

Design systems
One design system for 100+ brands
Each brand kept its look through tokens, and the components were built once.
The home and the results page were both fixed layouts, so nothing on them could vary and nothing could be learned from them. Rebuilding both as systems let the team run a continuous testing programme.
Around 165,000 bookings a day, in 90 points of sale, and every one of them started on those two screens.
Hotels.com sells in 41 languages and lists properties in over 200 countries. The two screens were a dated, static home, and a search results page on a fixed card.
Both were arrangements rather than systems. Nothing on either could respond to who was looking or what they were in the middle of, and because nothing could vary, no question about what a traveller actually needed to see could be answered. The app shipped on judgement and defended it afterwards.
A booking made again in the app avoided a cost we often paid on the first one, through Google or a comparison site. Hotel chains wanted those same travellers, and they offered member rates. The home barely showed the two reasons to come back: Secret Prices, and Rewards.
On the old iOS home, 15% of visits reached a hotel page, 12% reached sign in, and 12% reached an upcoming booking. That is the control group from the iOS test, October to November 2016.
One programme for both screens, instead of a separate launch for each idea.
The home moved from a fixed layout to a modular and scalable one, with a single brand language holding it together across iOS and Android, and it was the first personalisation work the company had done. Search results moved from static cards to dynamic ones, so that a card could carry different amounts of content in the same slot. Android went first, in April 2016, with nine personalised cards, on the hope that engagement would lift bookings. iOS followed in October, moving onto the same cards with a narrower aim: hold the booking rate.
What ran through them was a standing programme across product, design, engineering and analytics, built to fail fast and iterate. Its operating principle, in the words used at the time: create a hypothesis to give us an opportunity to learn, not to predict. A losing test can still teach something, which is why the one below stayed in.
The 2019 refresh pushed the same idea further: a global rebrand with parity across platforms, machine learning behind modules like recommended destinations and travel guides, and a shift towards content before, during and after a trip rather than only at the point of booking.
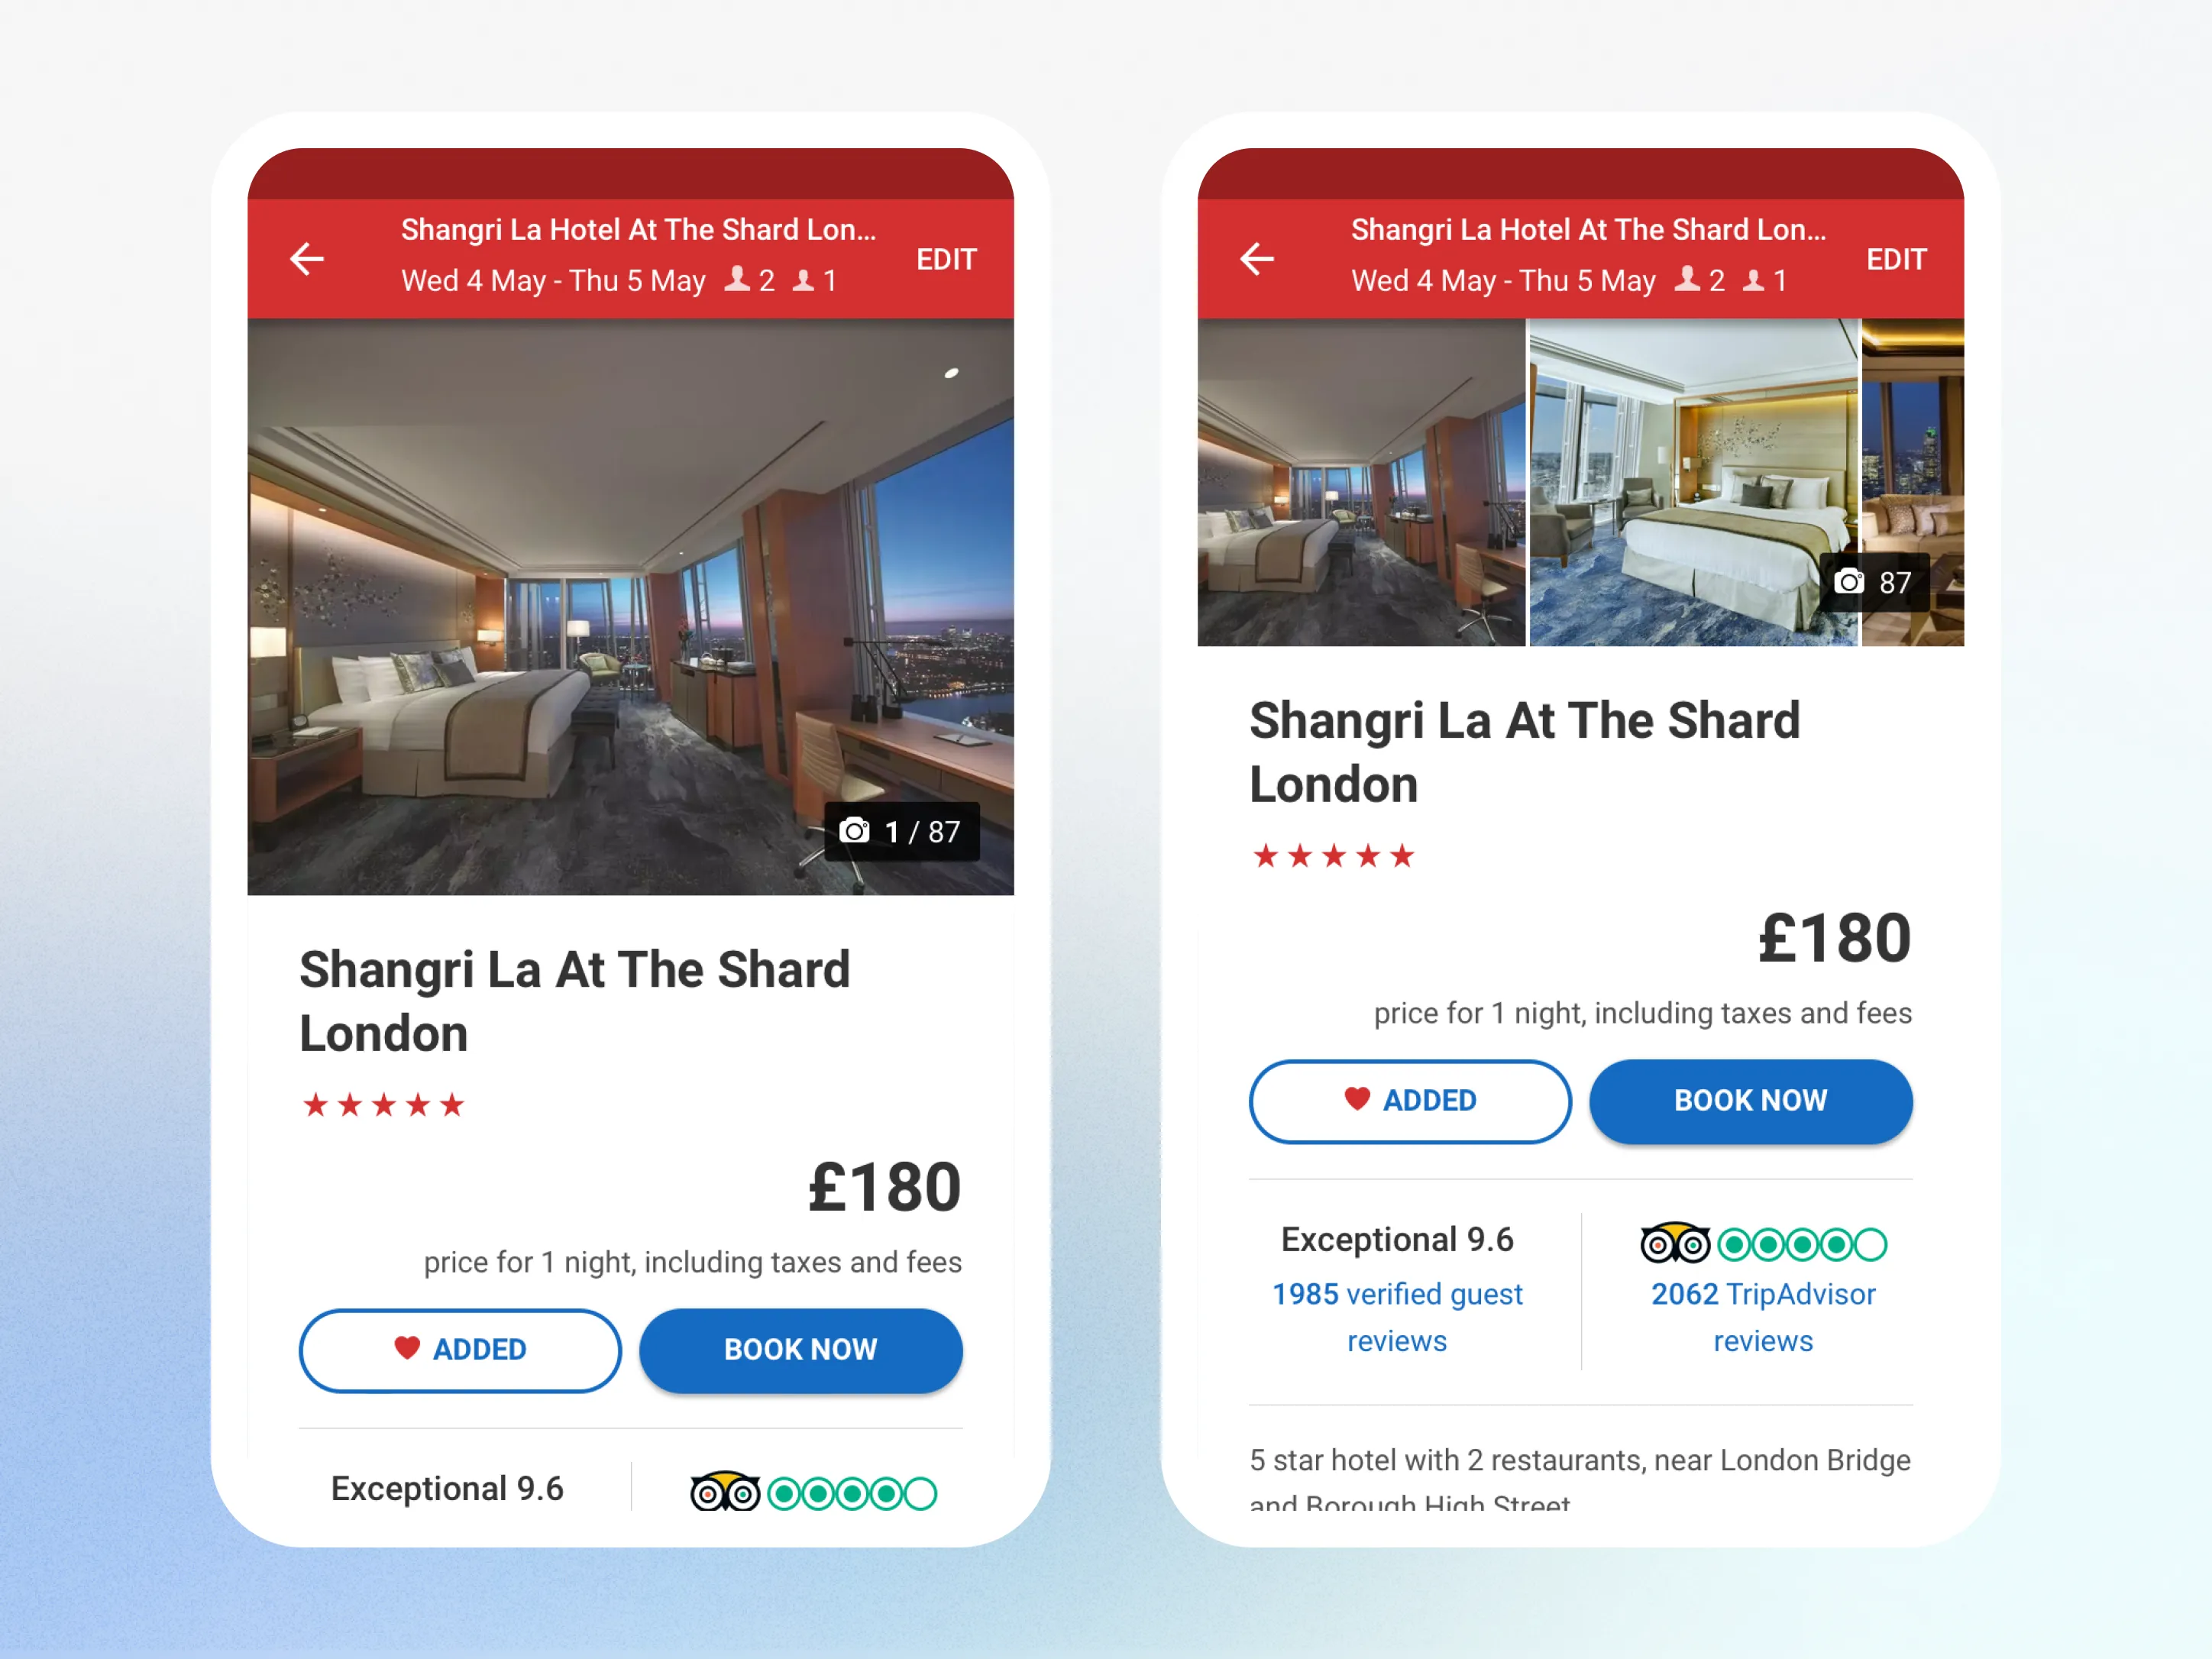
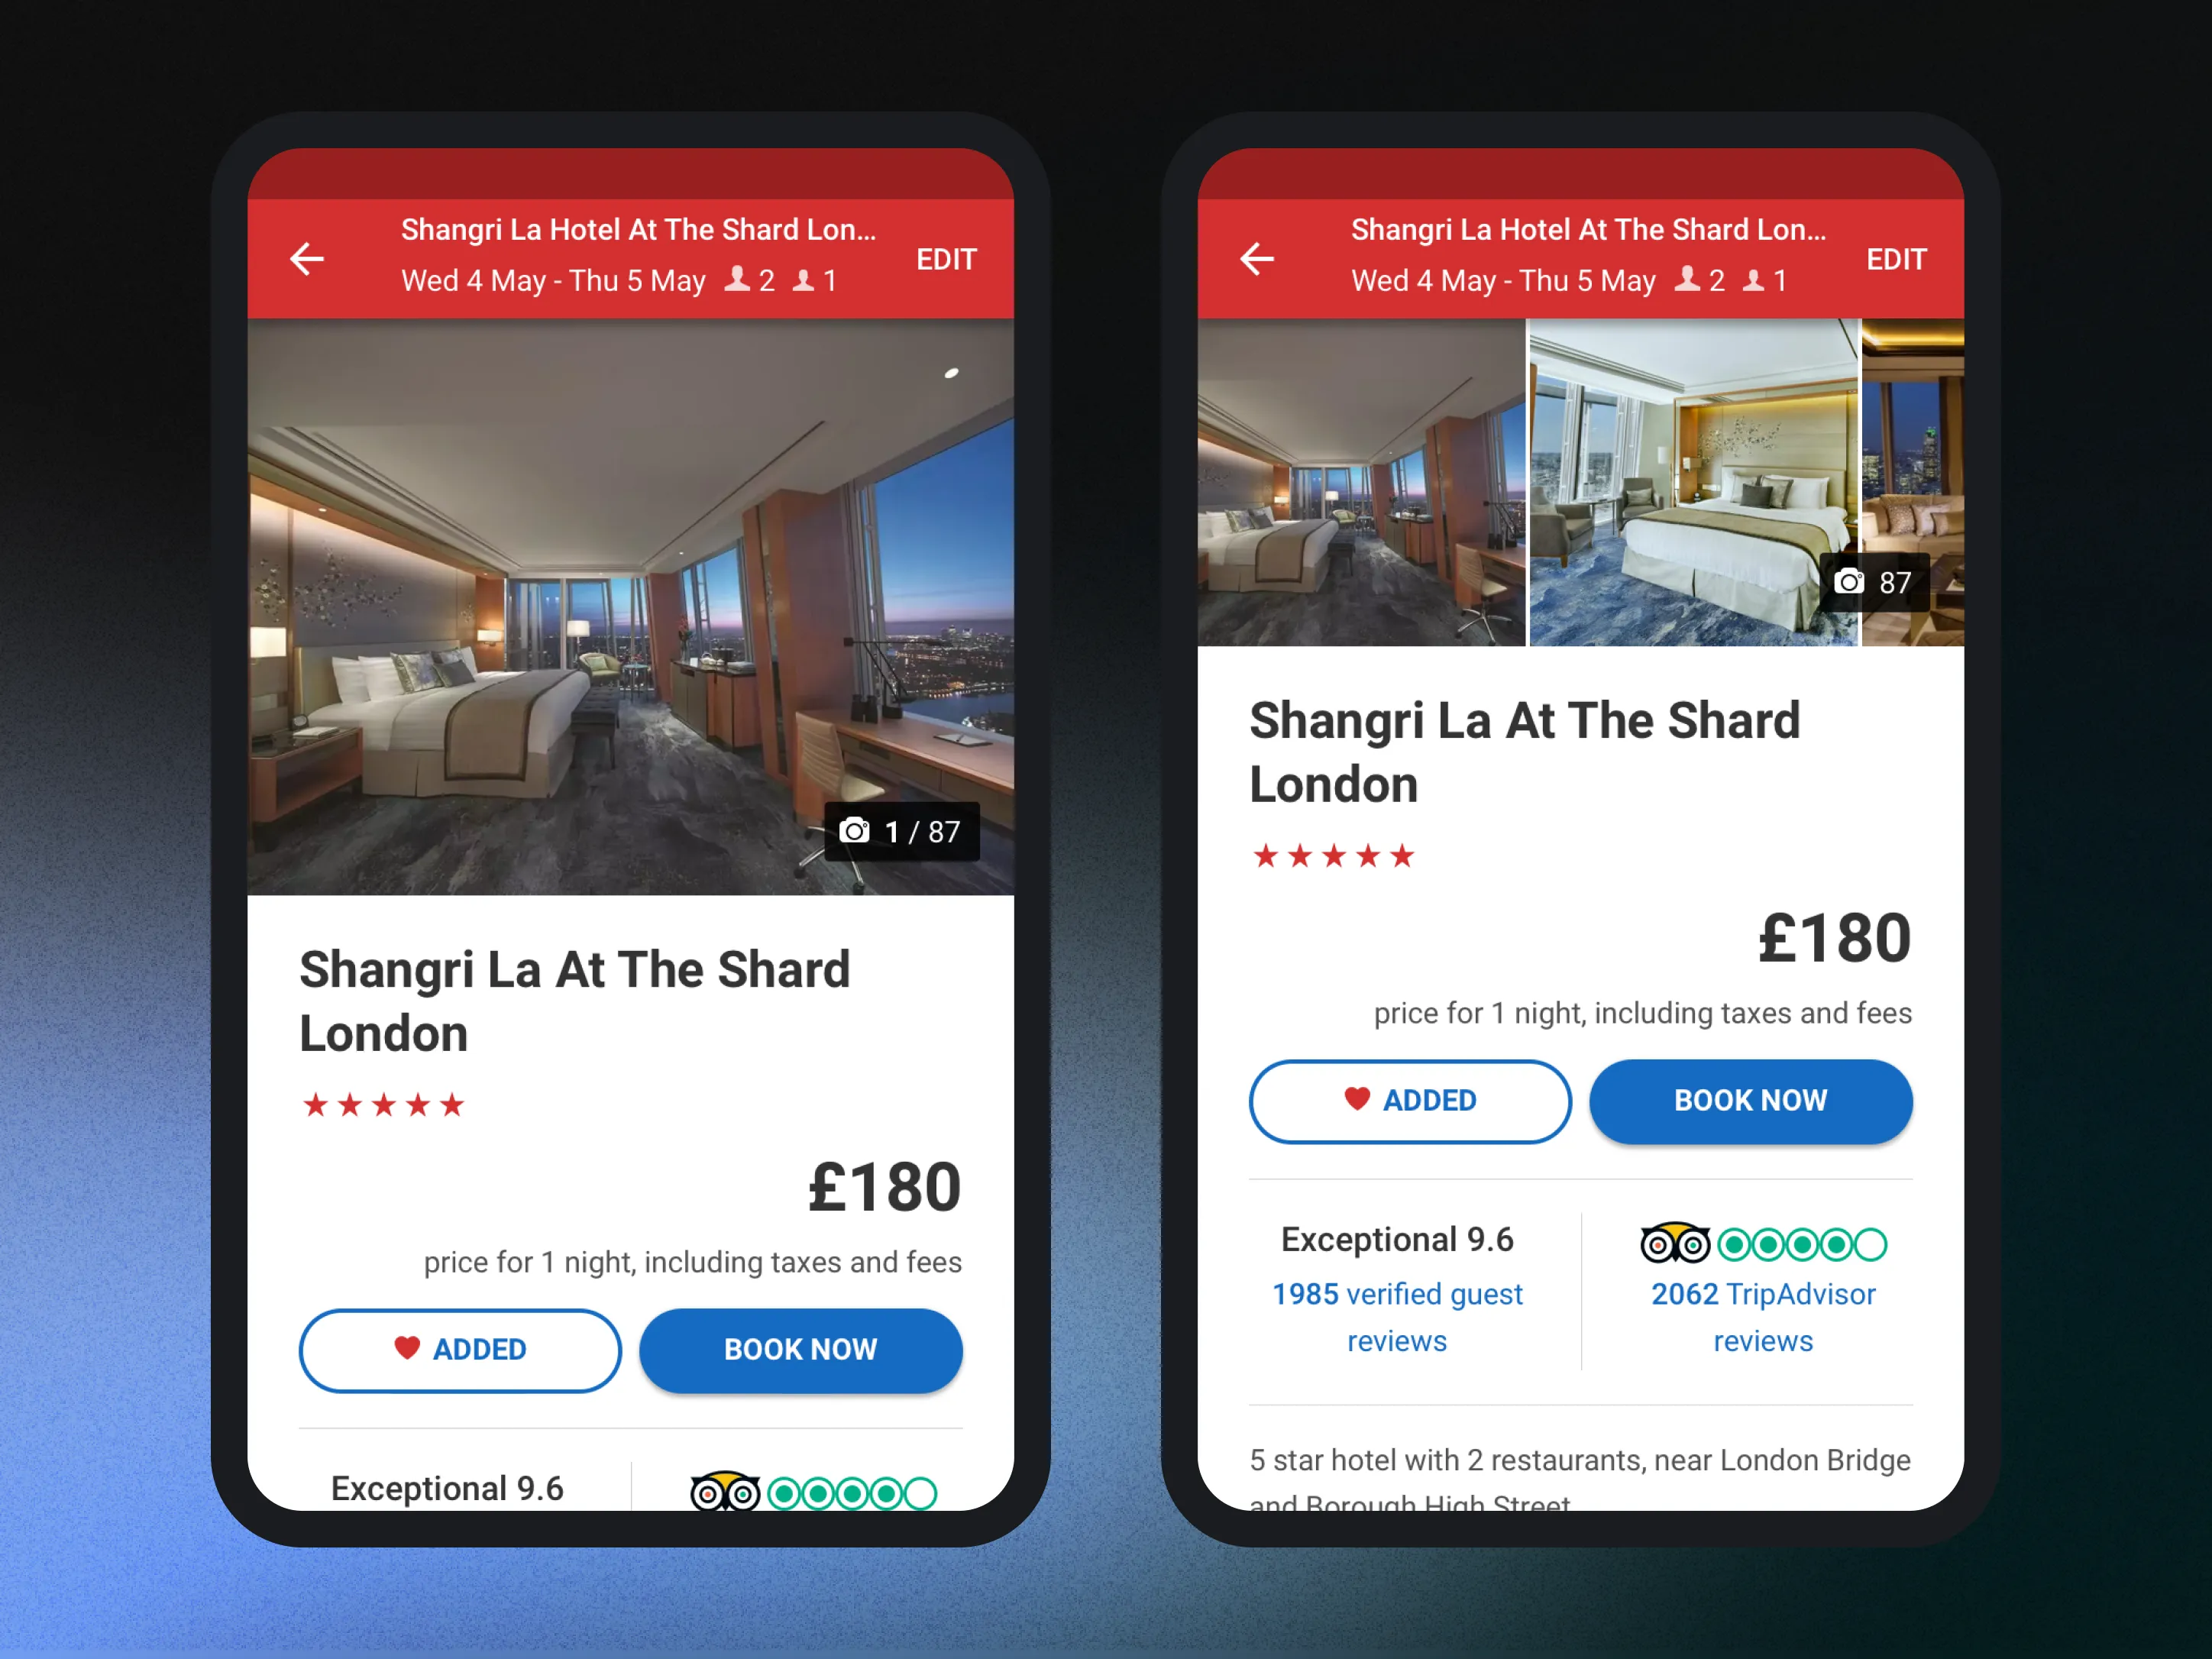
Won. One test, with a single fixed photograph as the control and one variant showing three. Conversion moved, and gallery interaction moved by a great deal more. Travellers had wanted the photographs, and the old arrangement had been showing them one. It also sent better-qualified shoppers through to the booking form, not simply more of them.
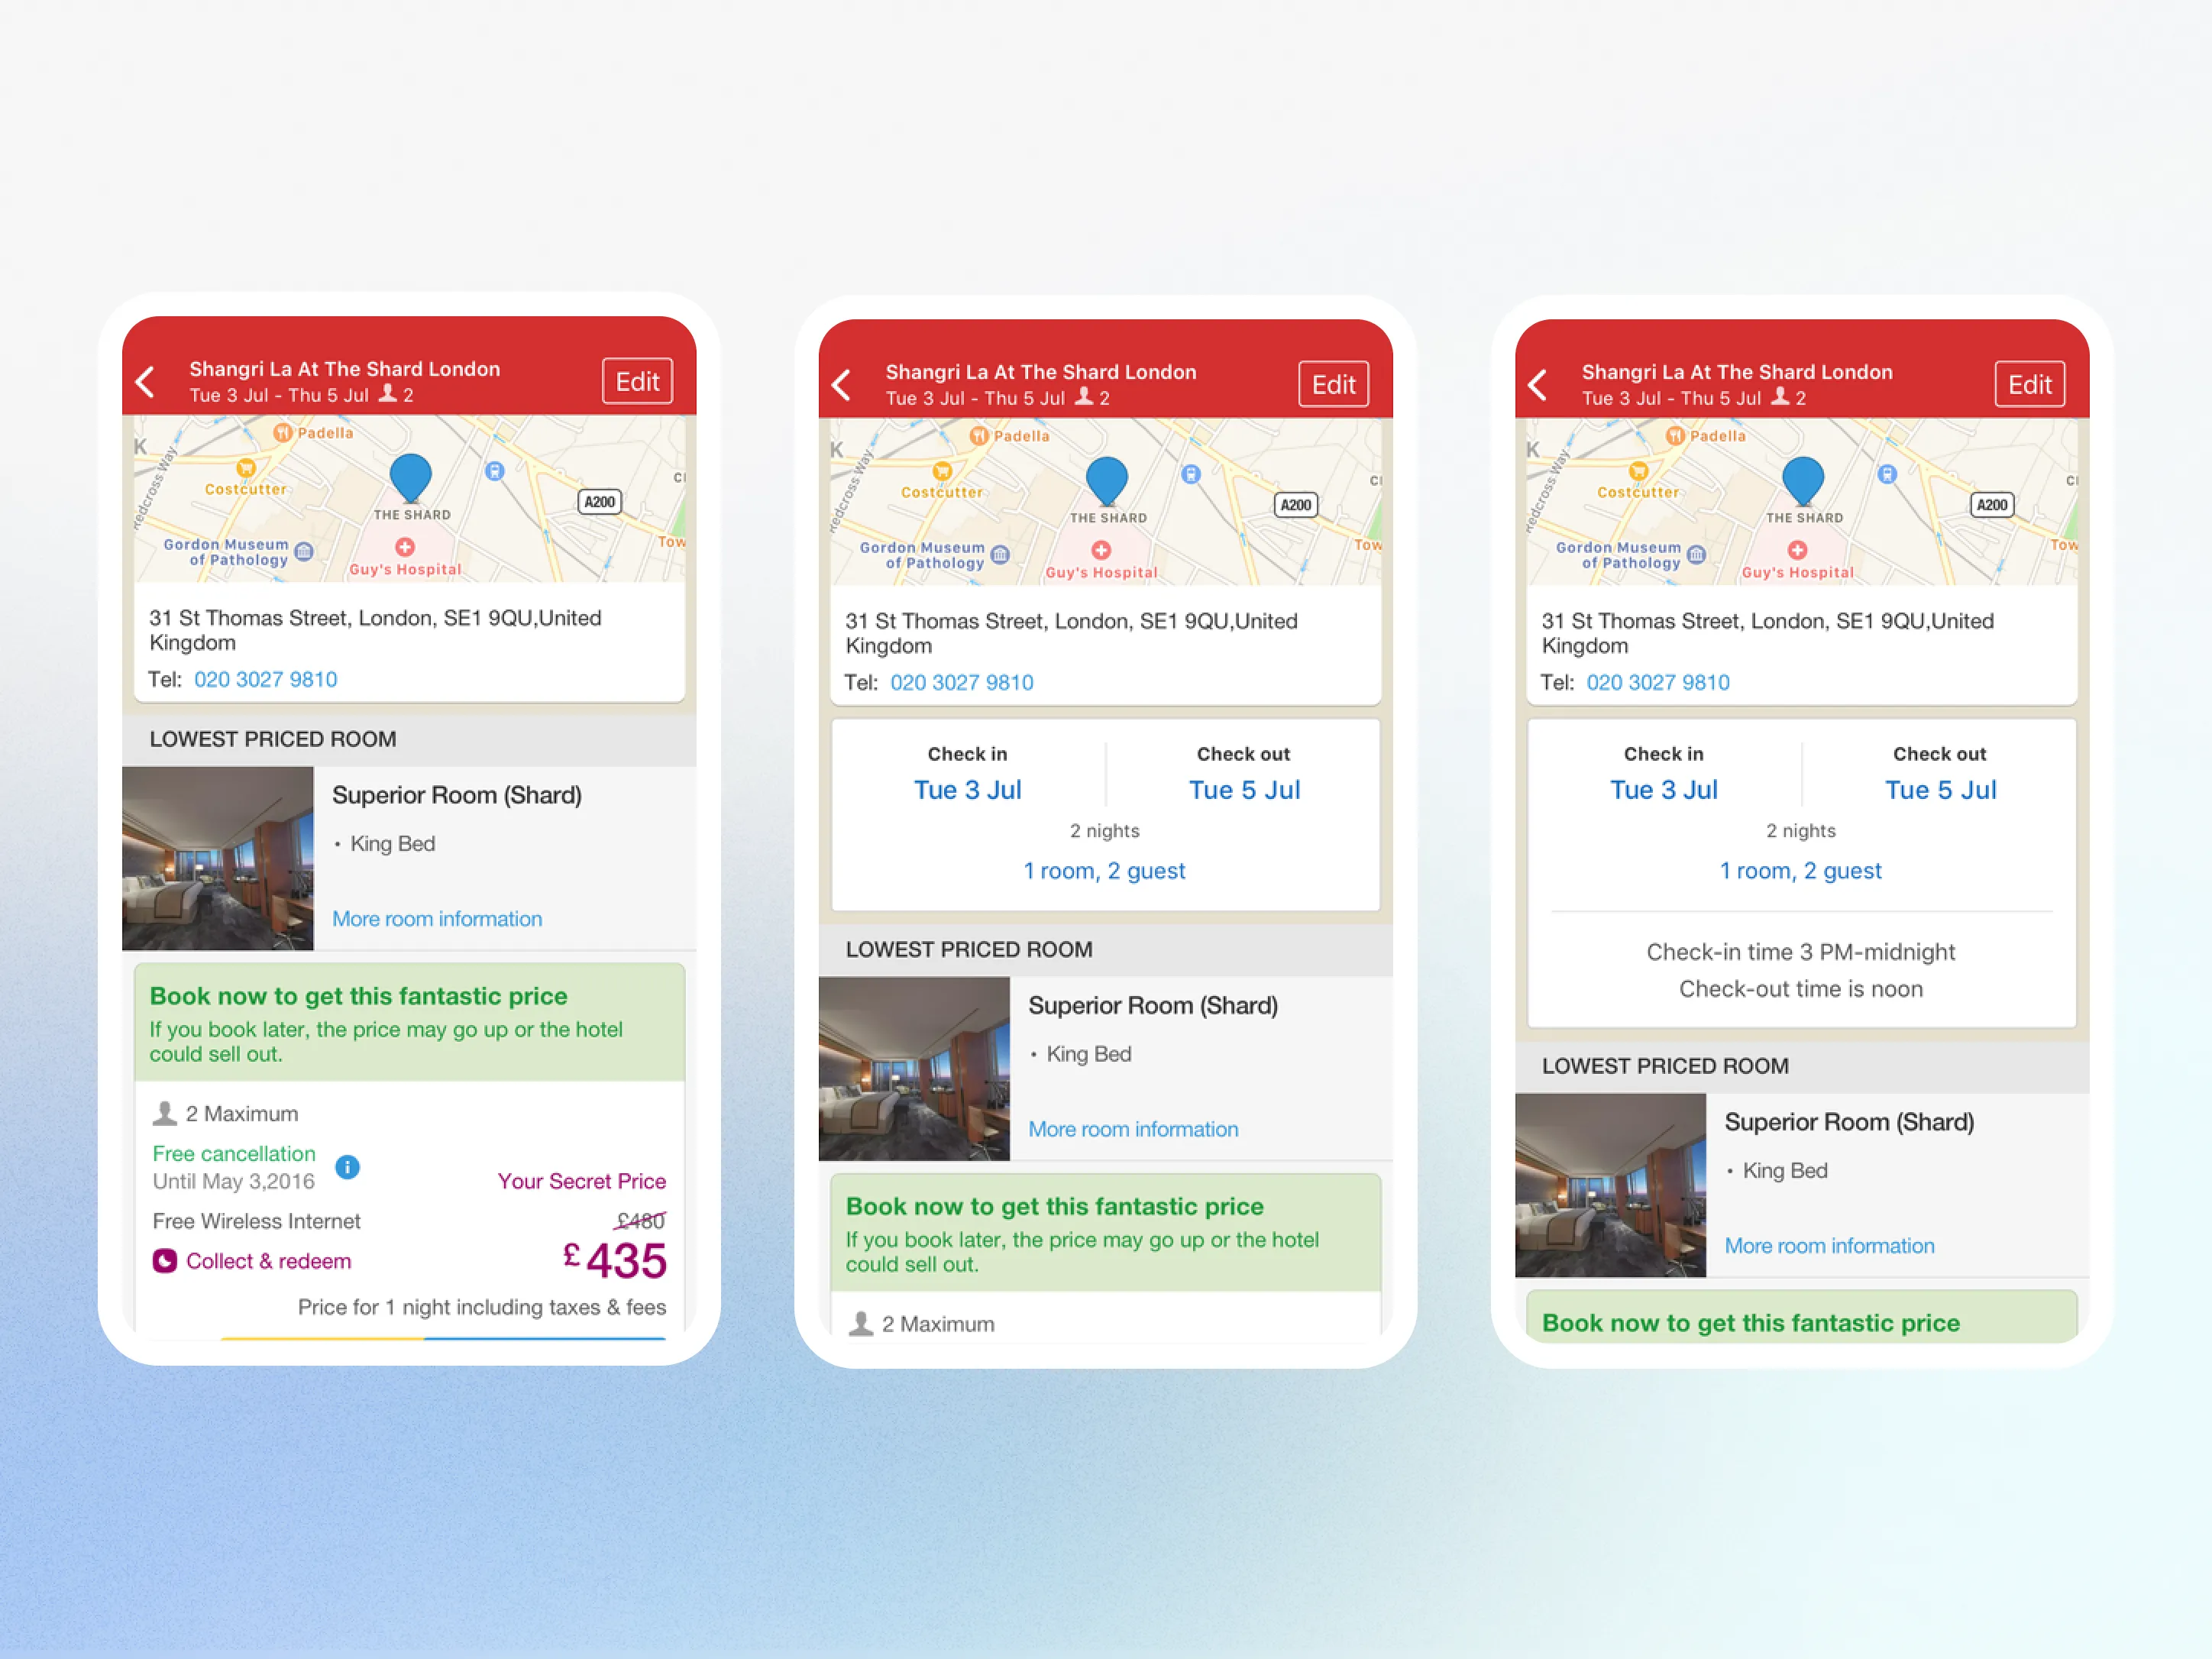
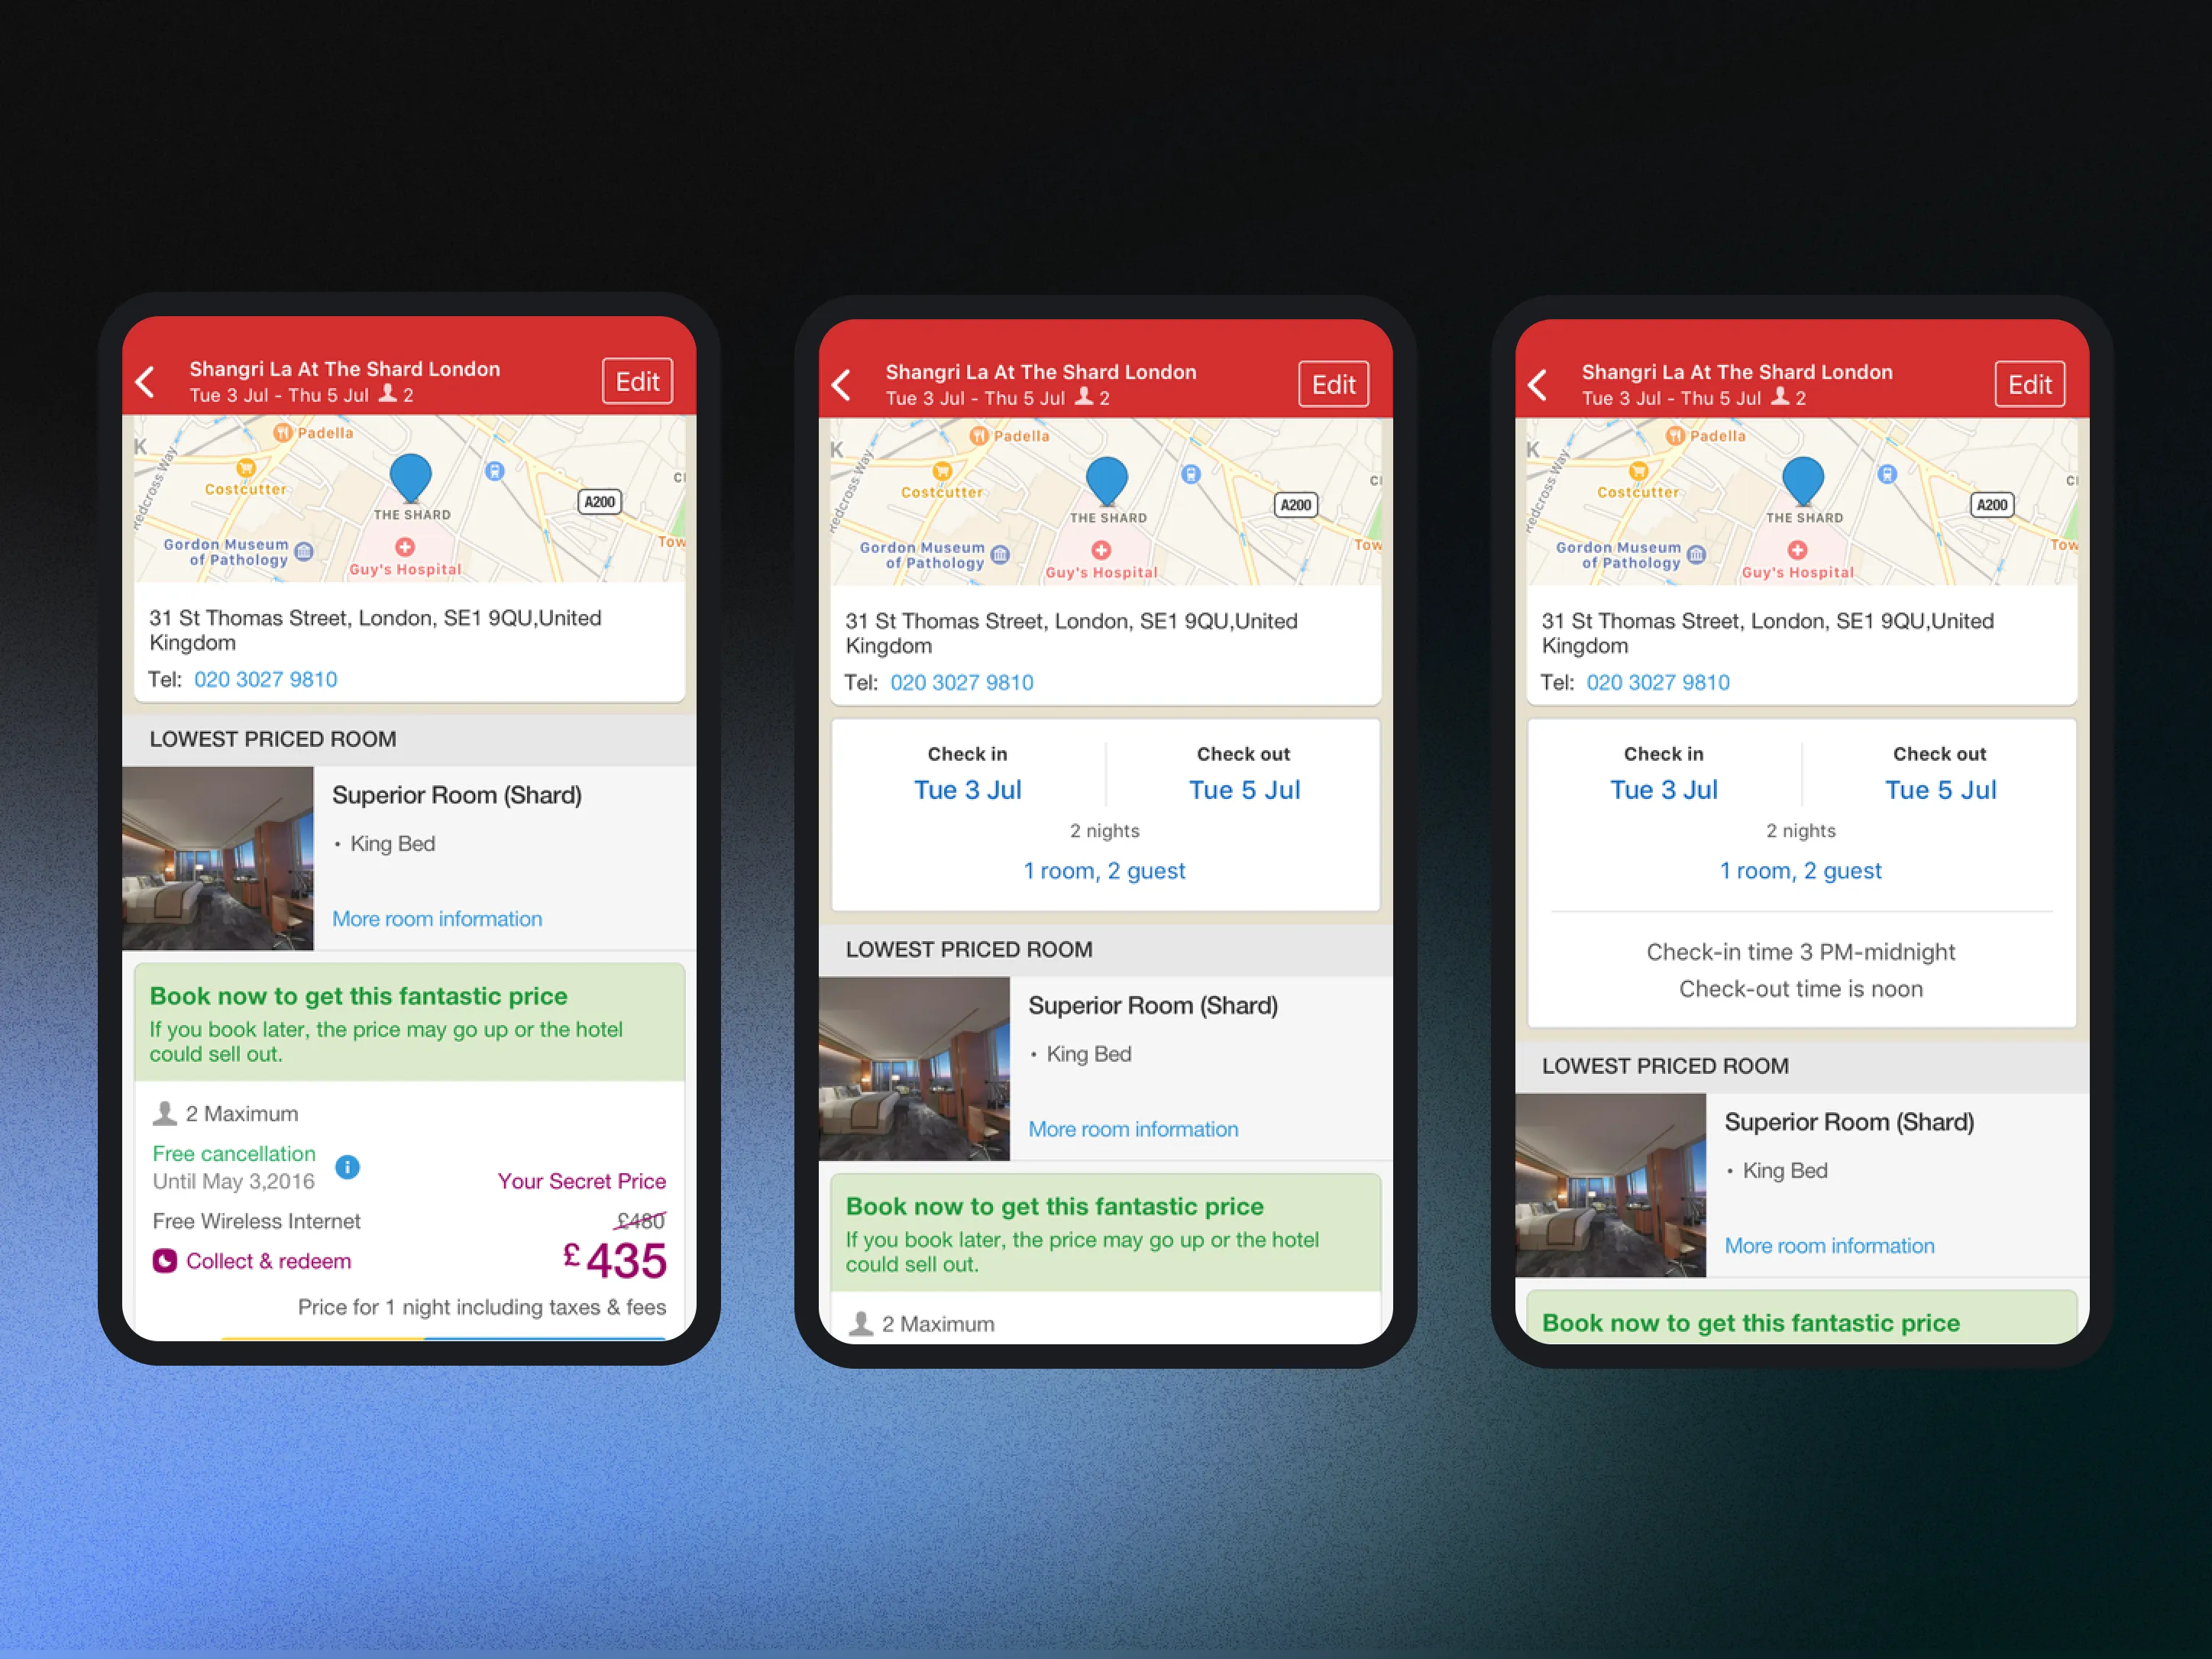
Lost, and then lost harder. The first variant added check-in and check-out, and the second added the times as well and did worse on every measure. The problem was summarising back to travellers something they had told us thirty seconds earlier.
Unresolved. It was still running when it was written down, and it never produced a verdict. A test without an answer stays in the record.
A home whose modules changed with context, and a results card that could hold a different amount of content in the same slot.
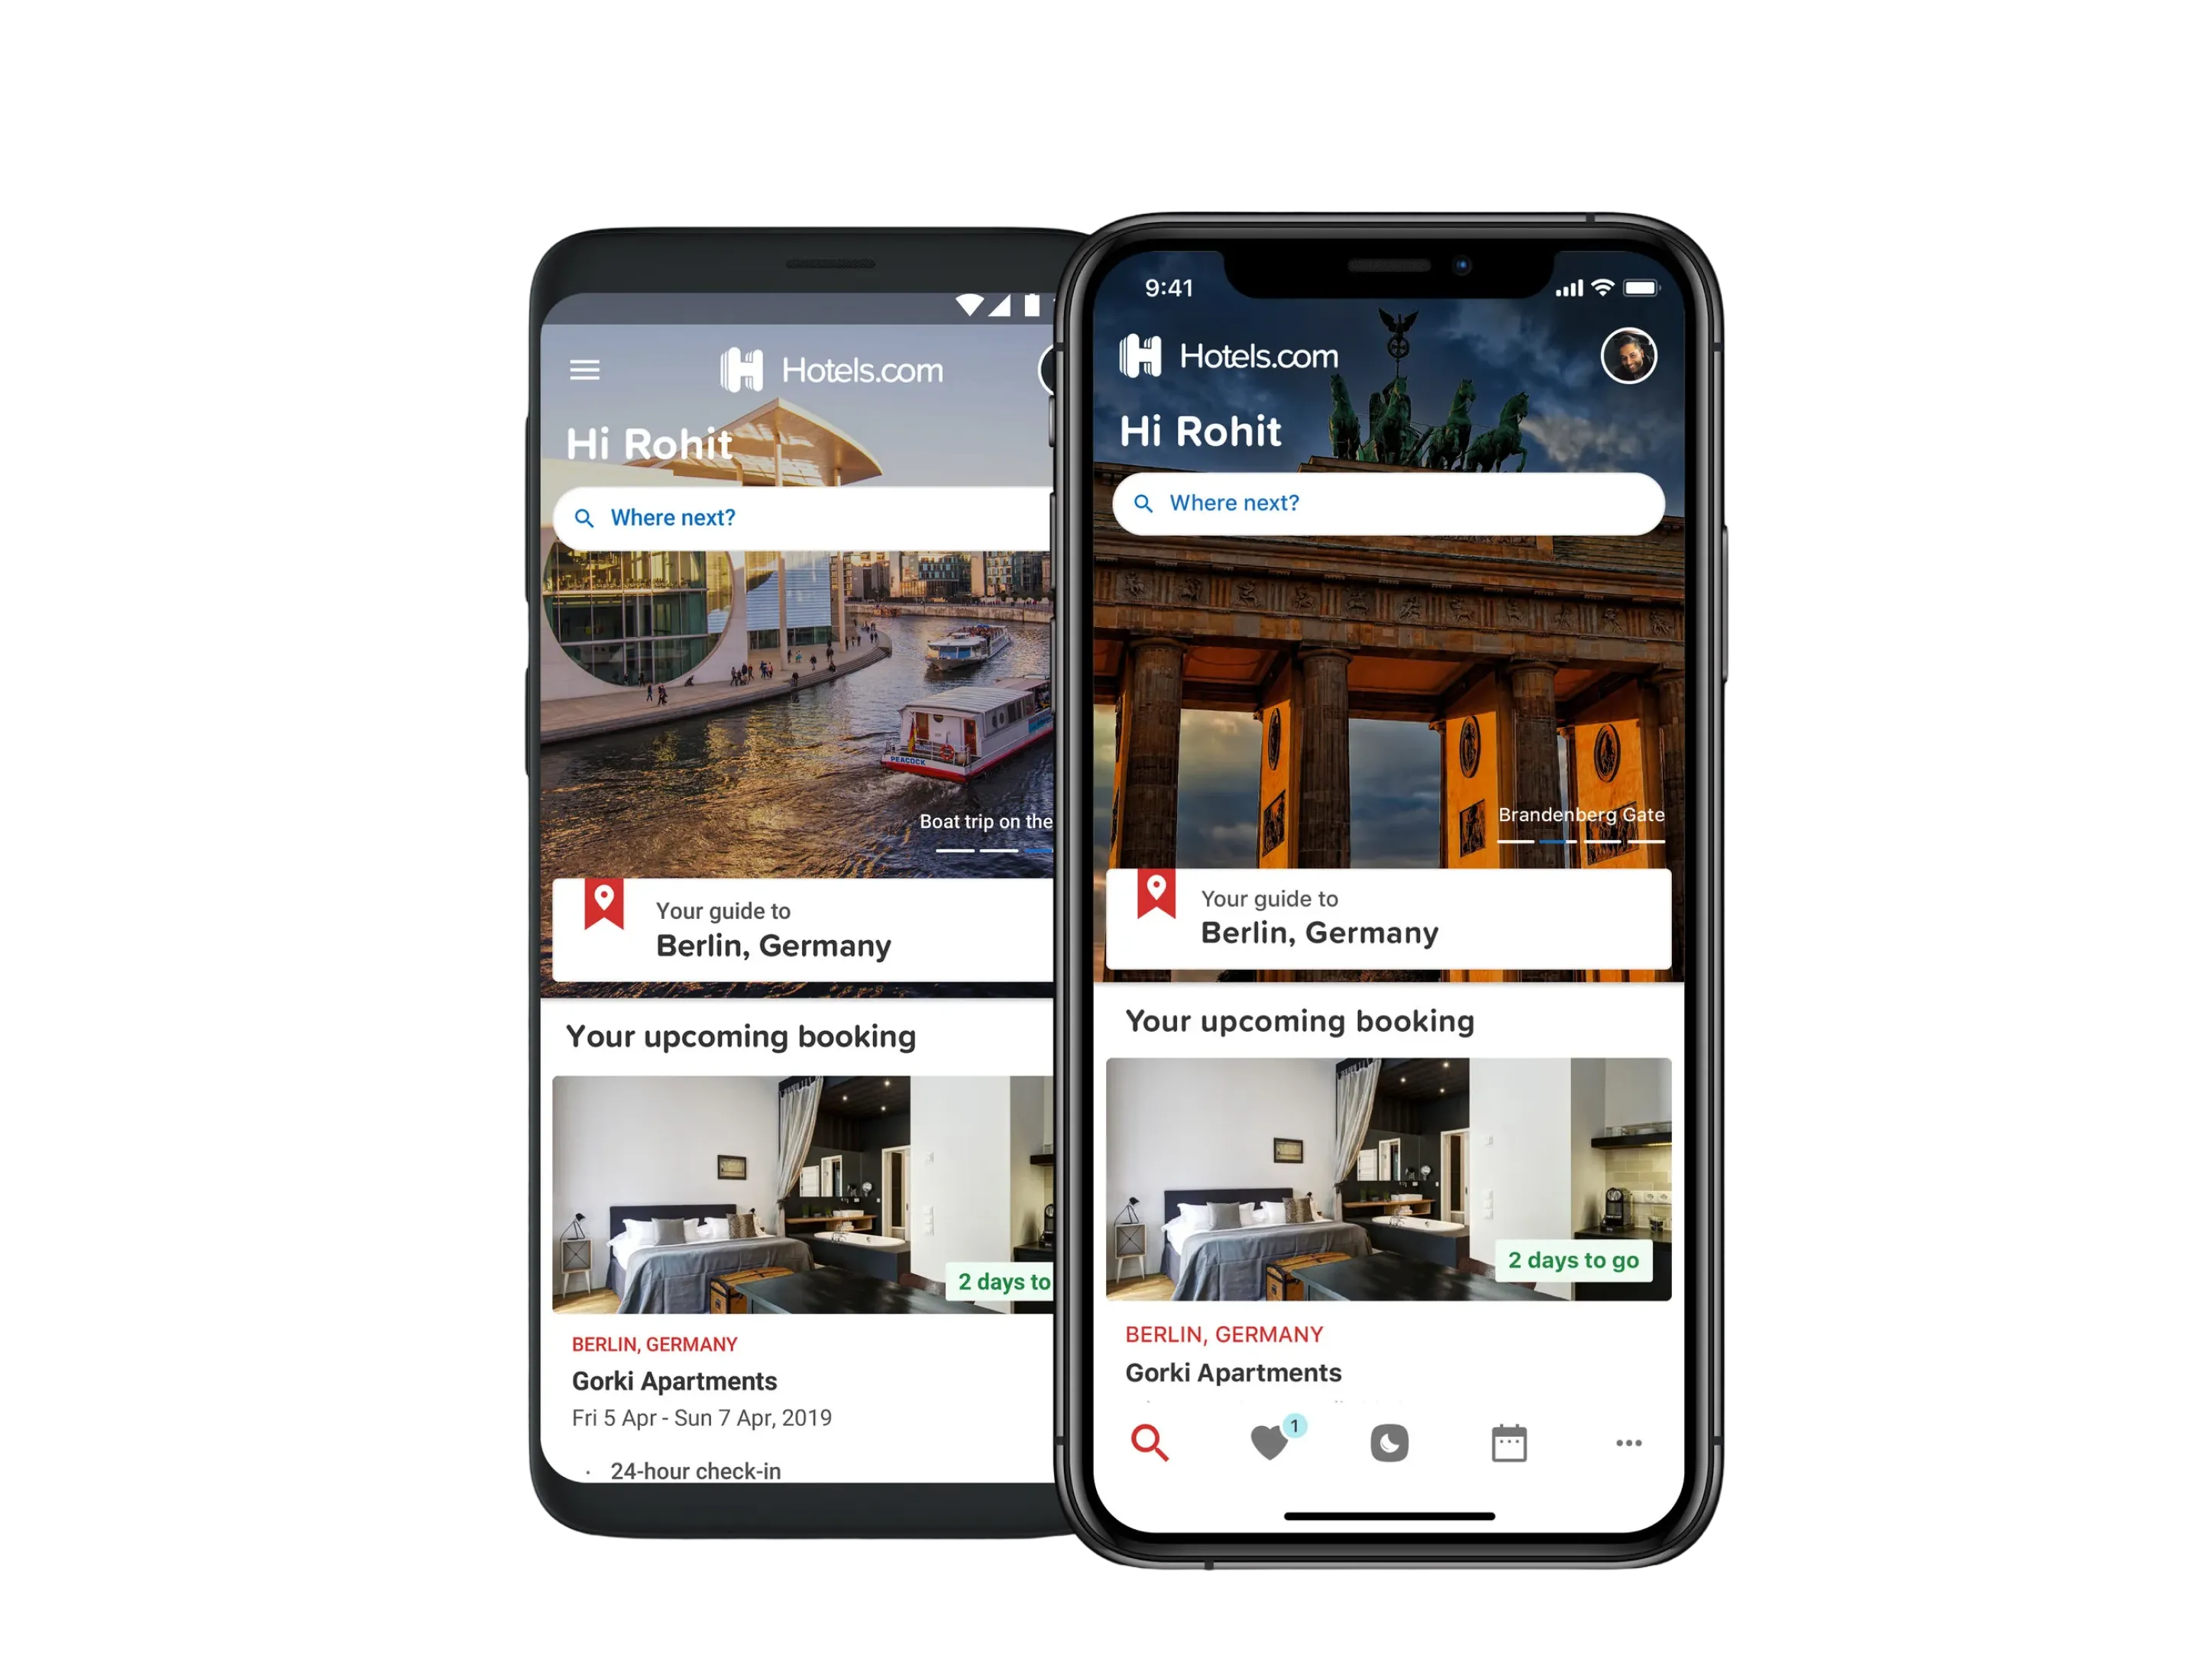
A search card laid over a destination photograph, with recently viewed beneath it.
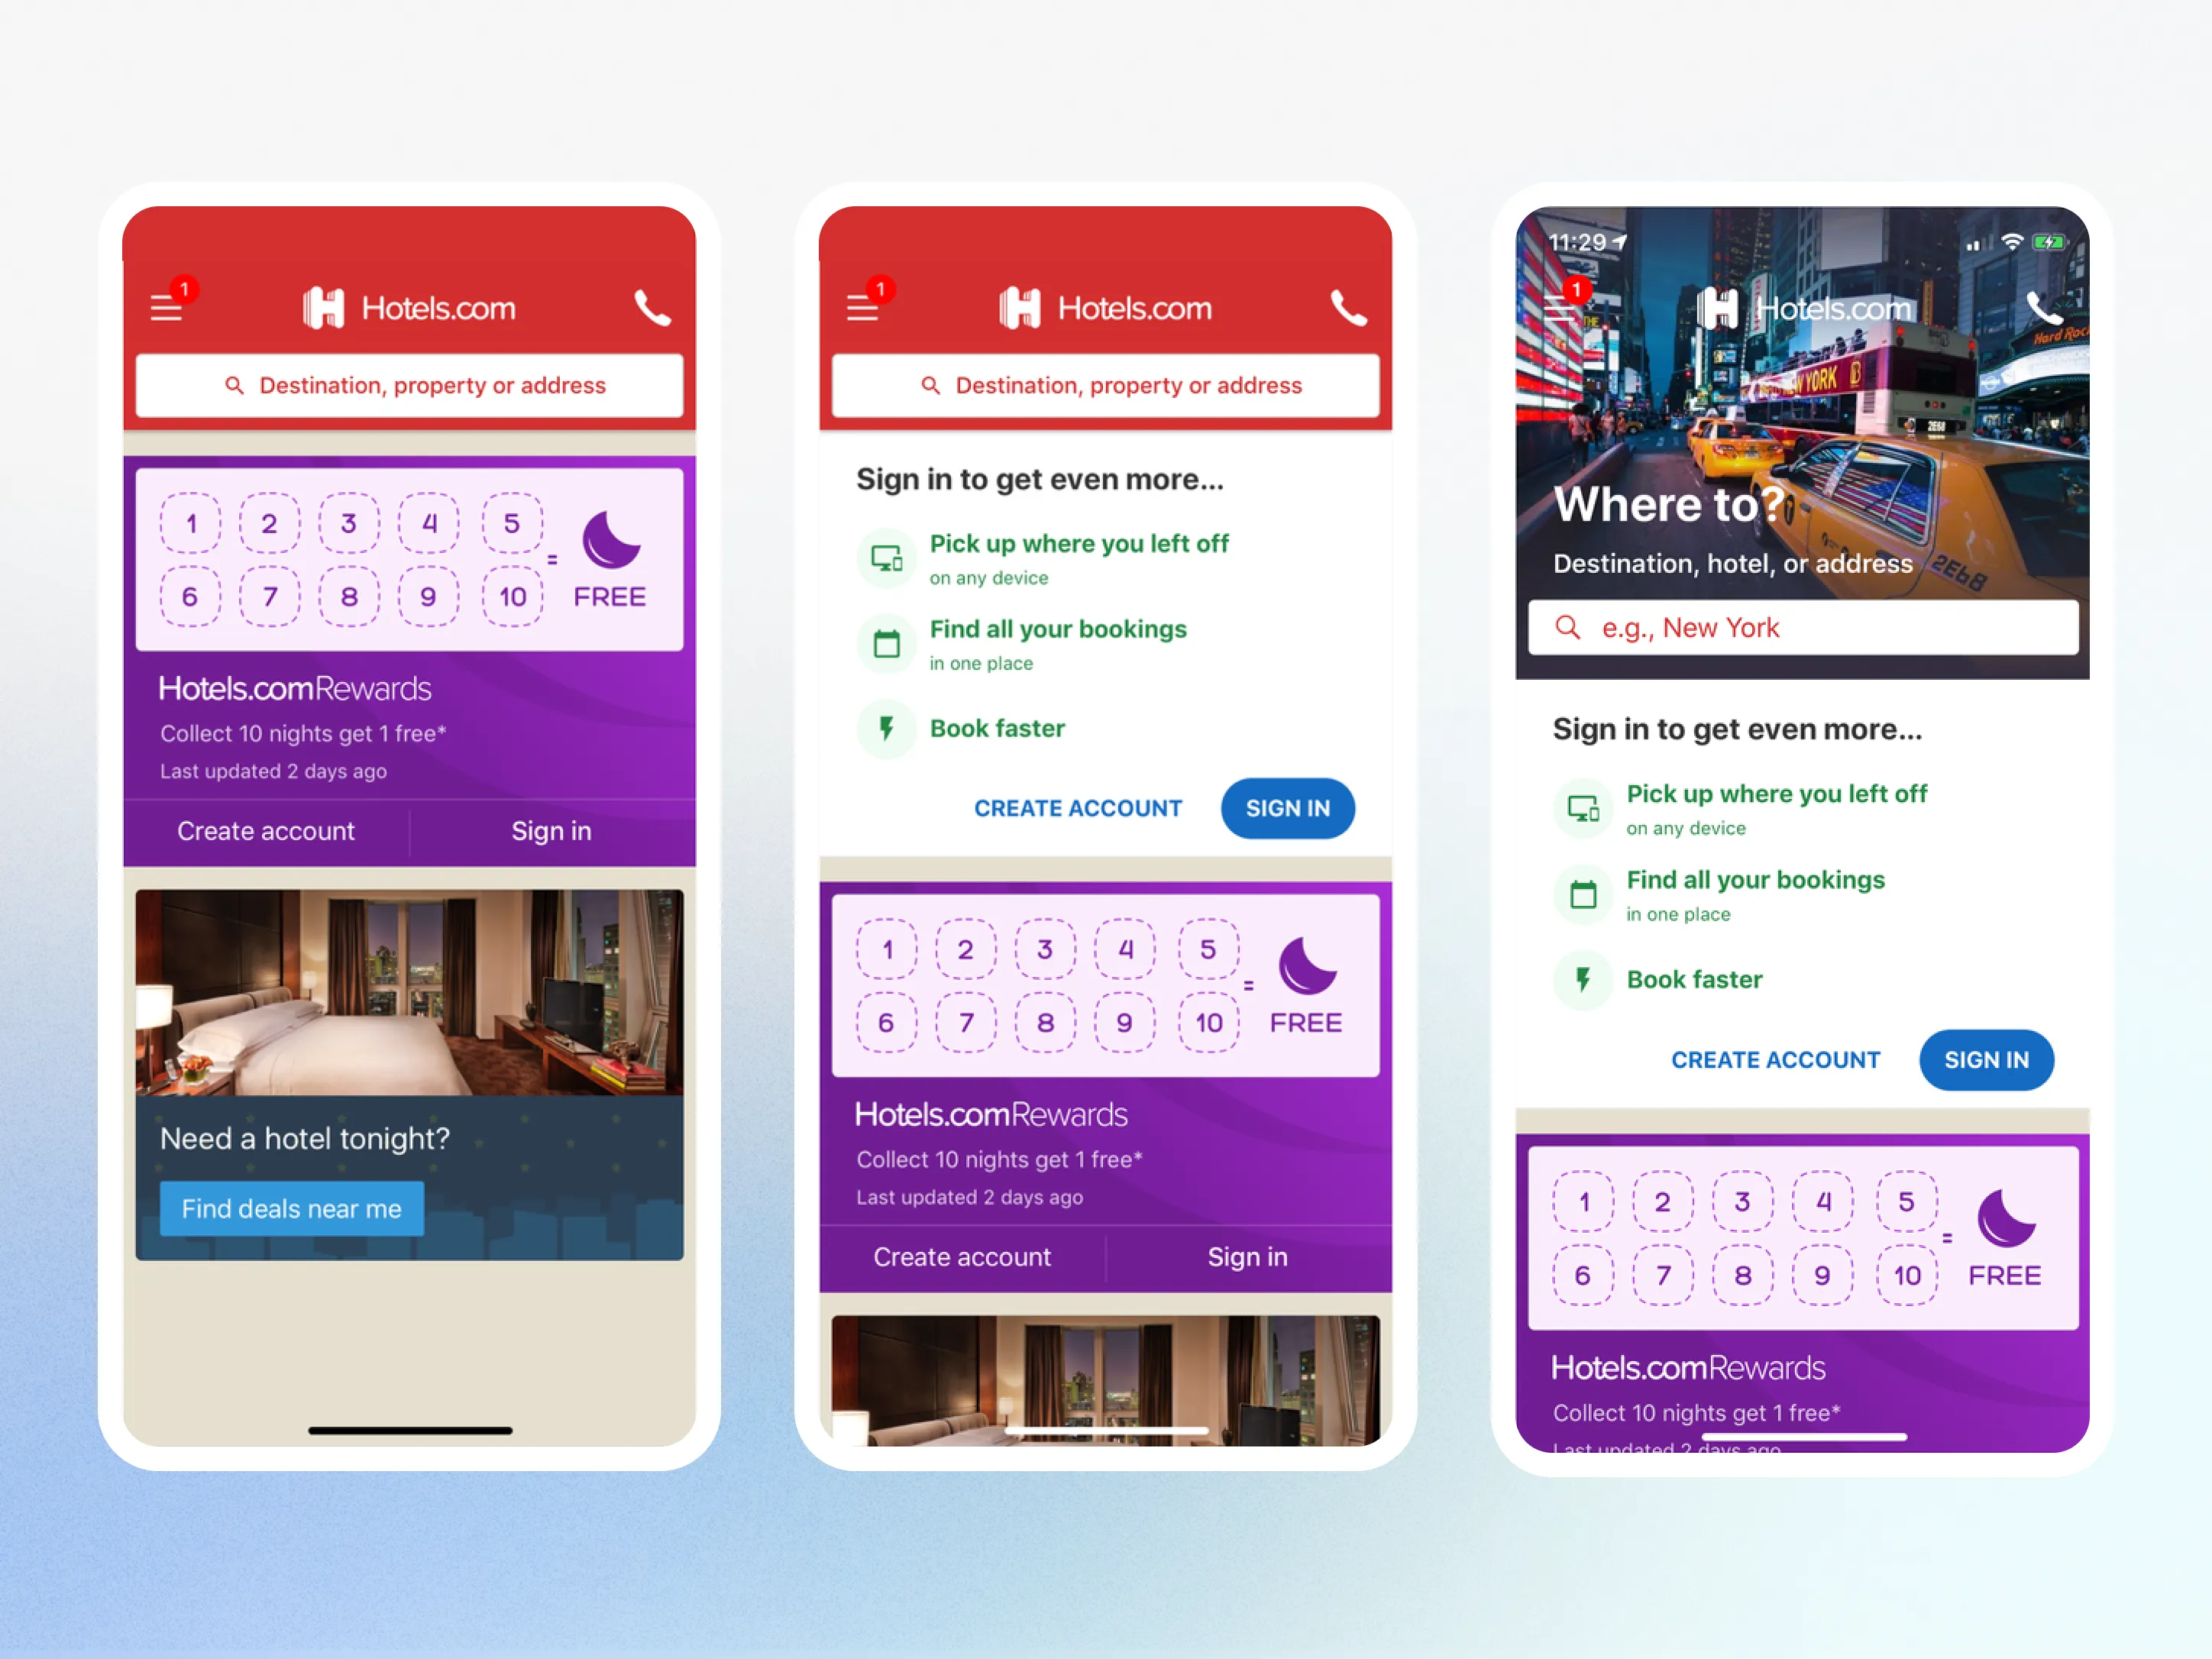
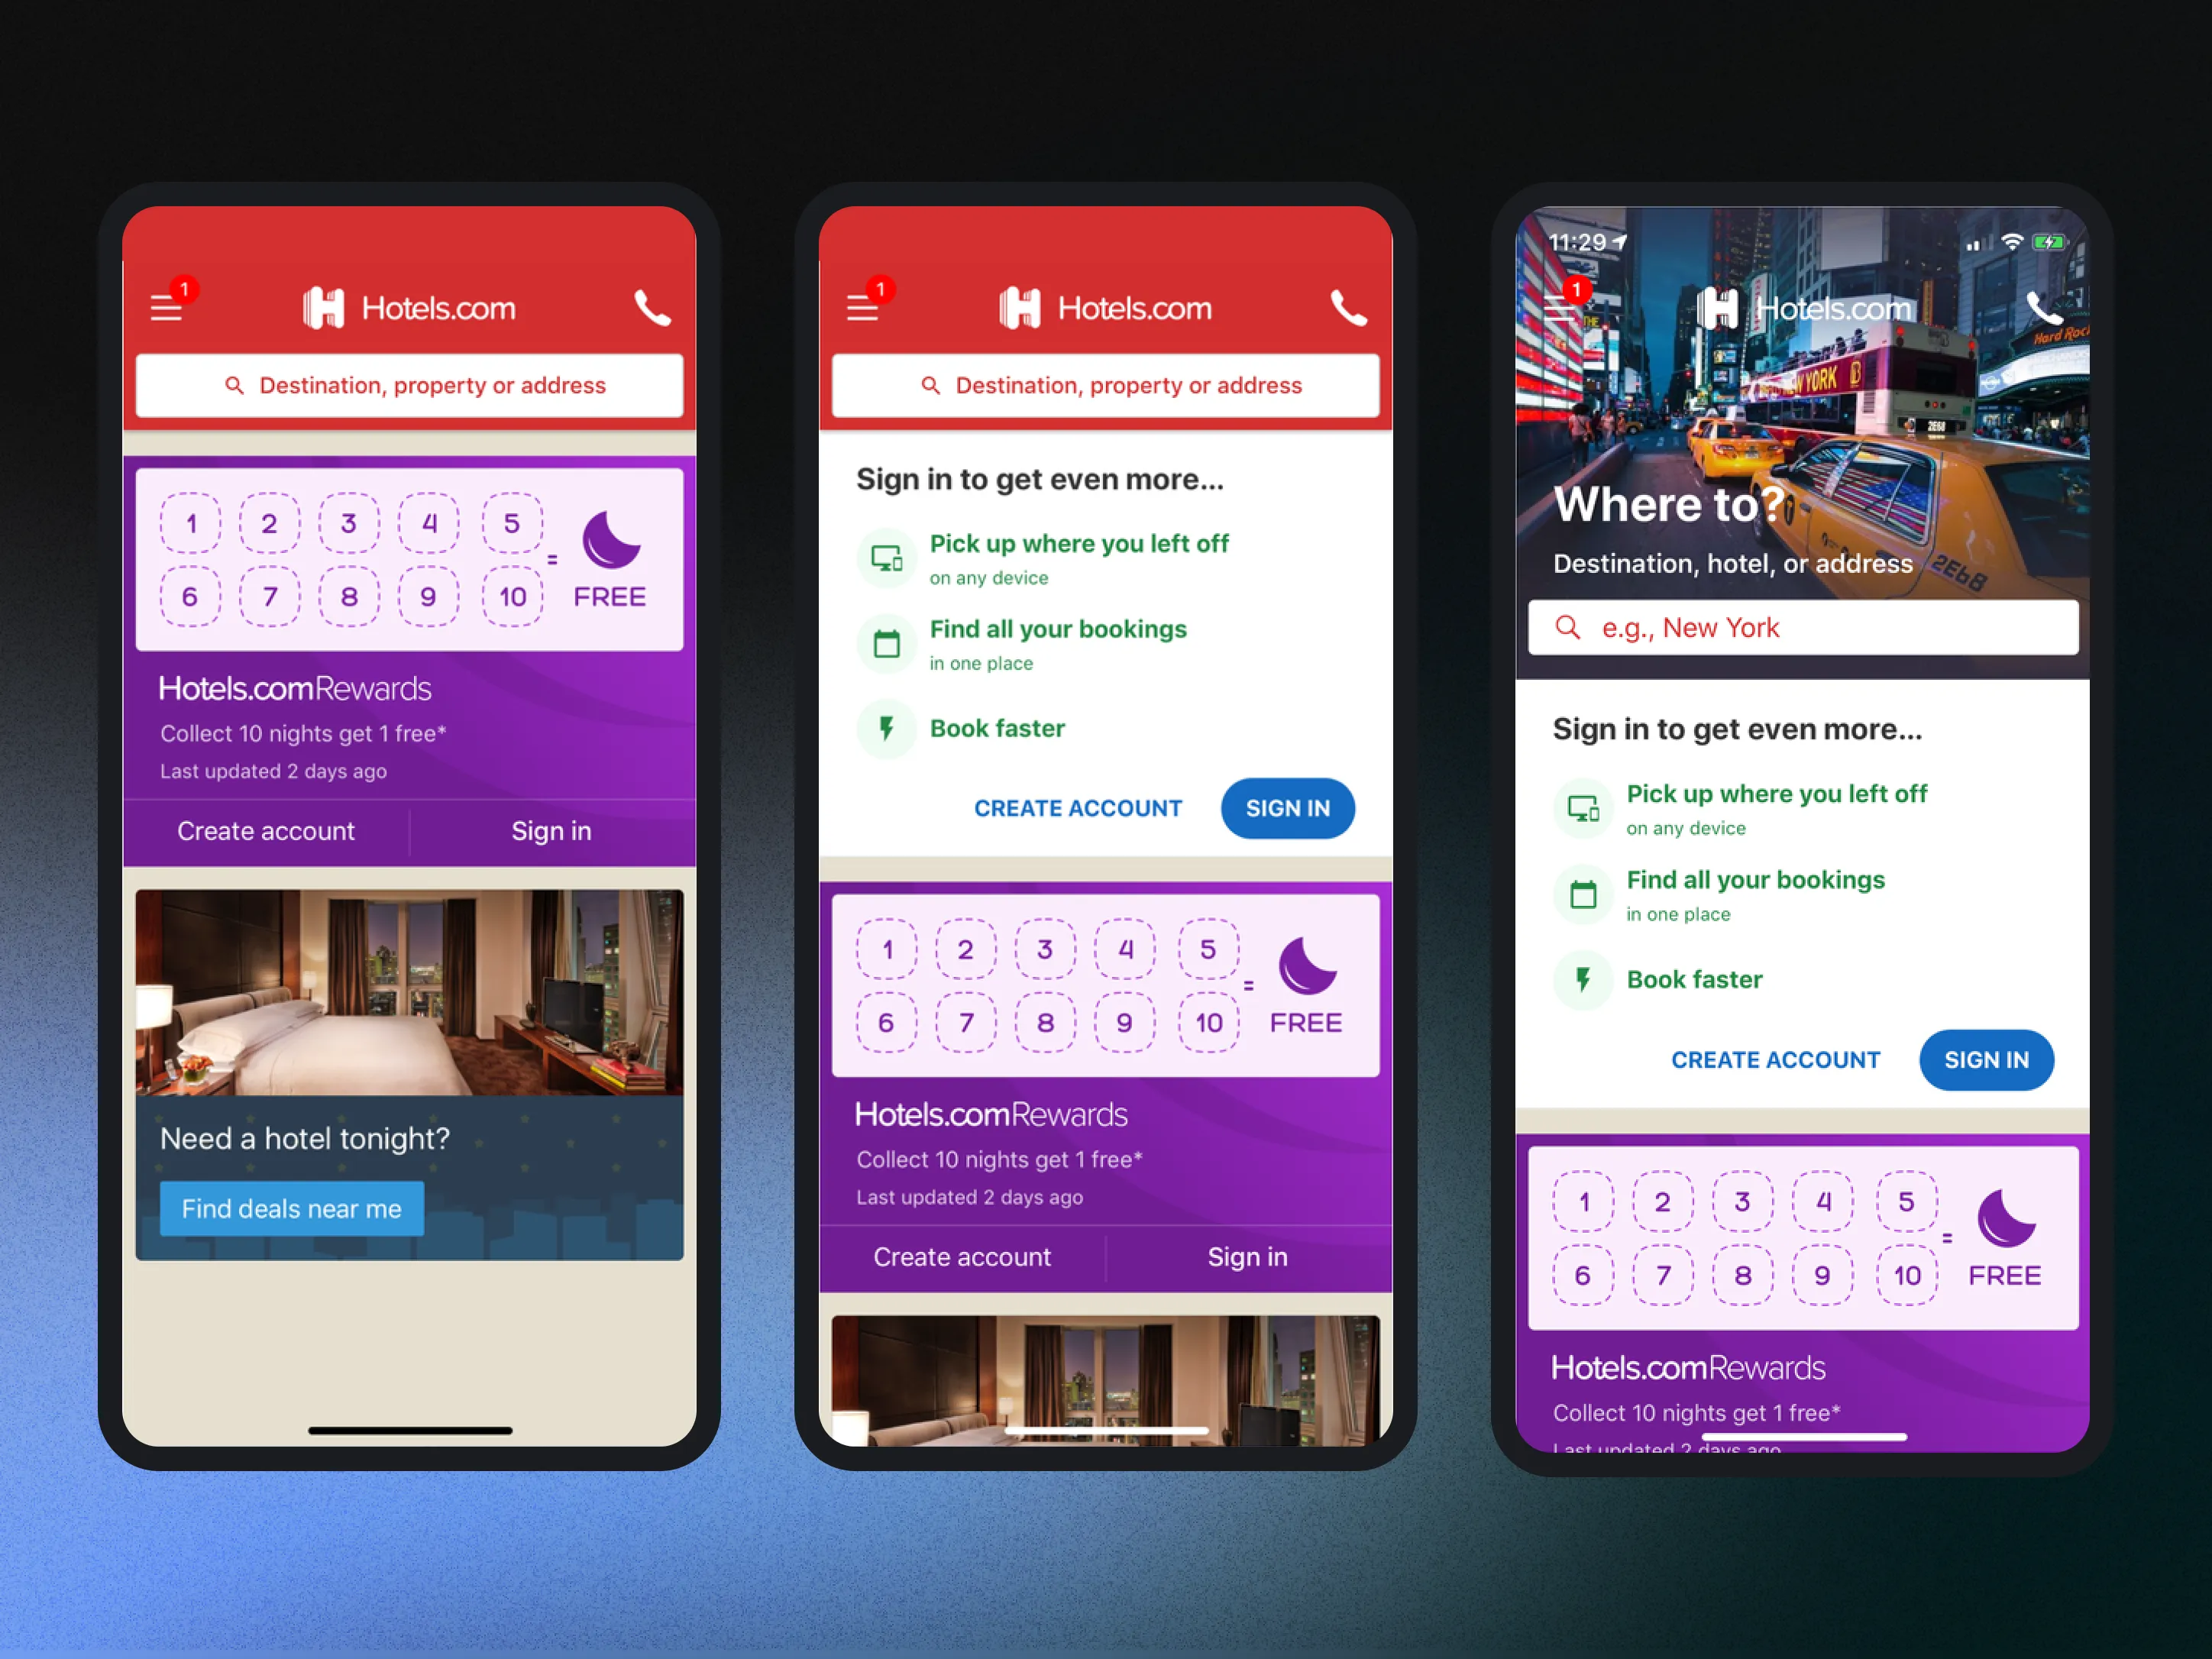
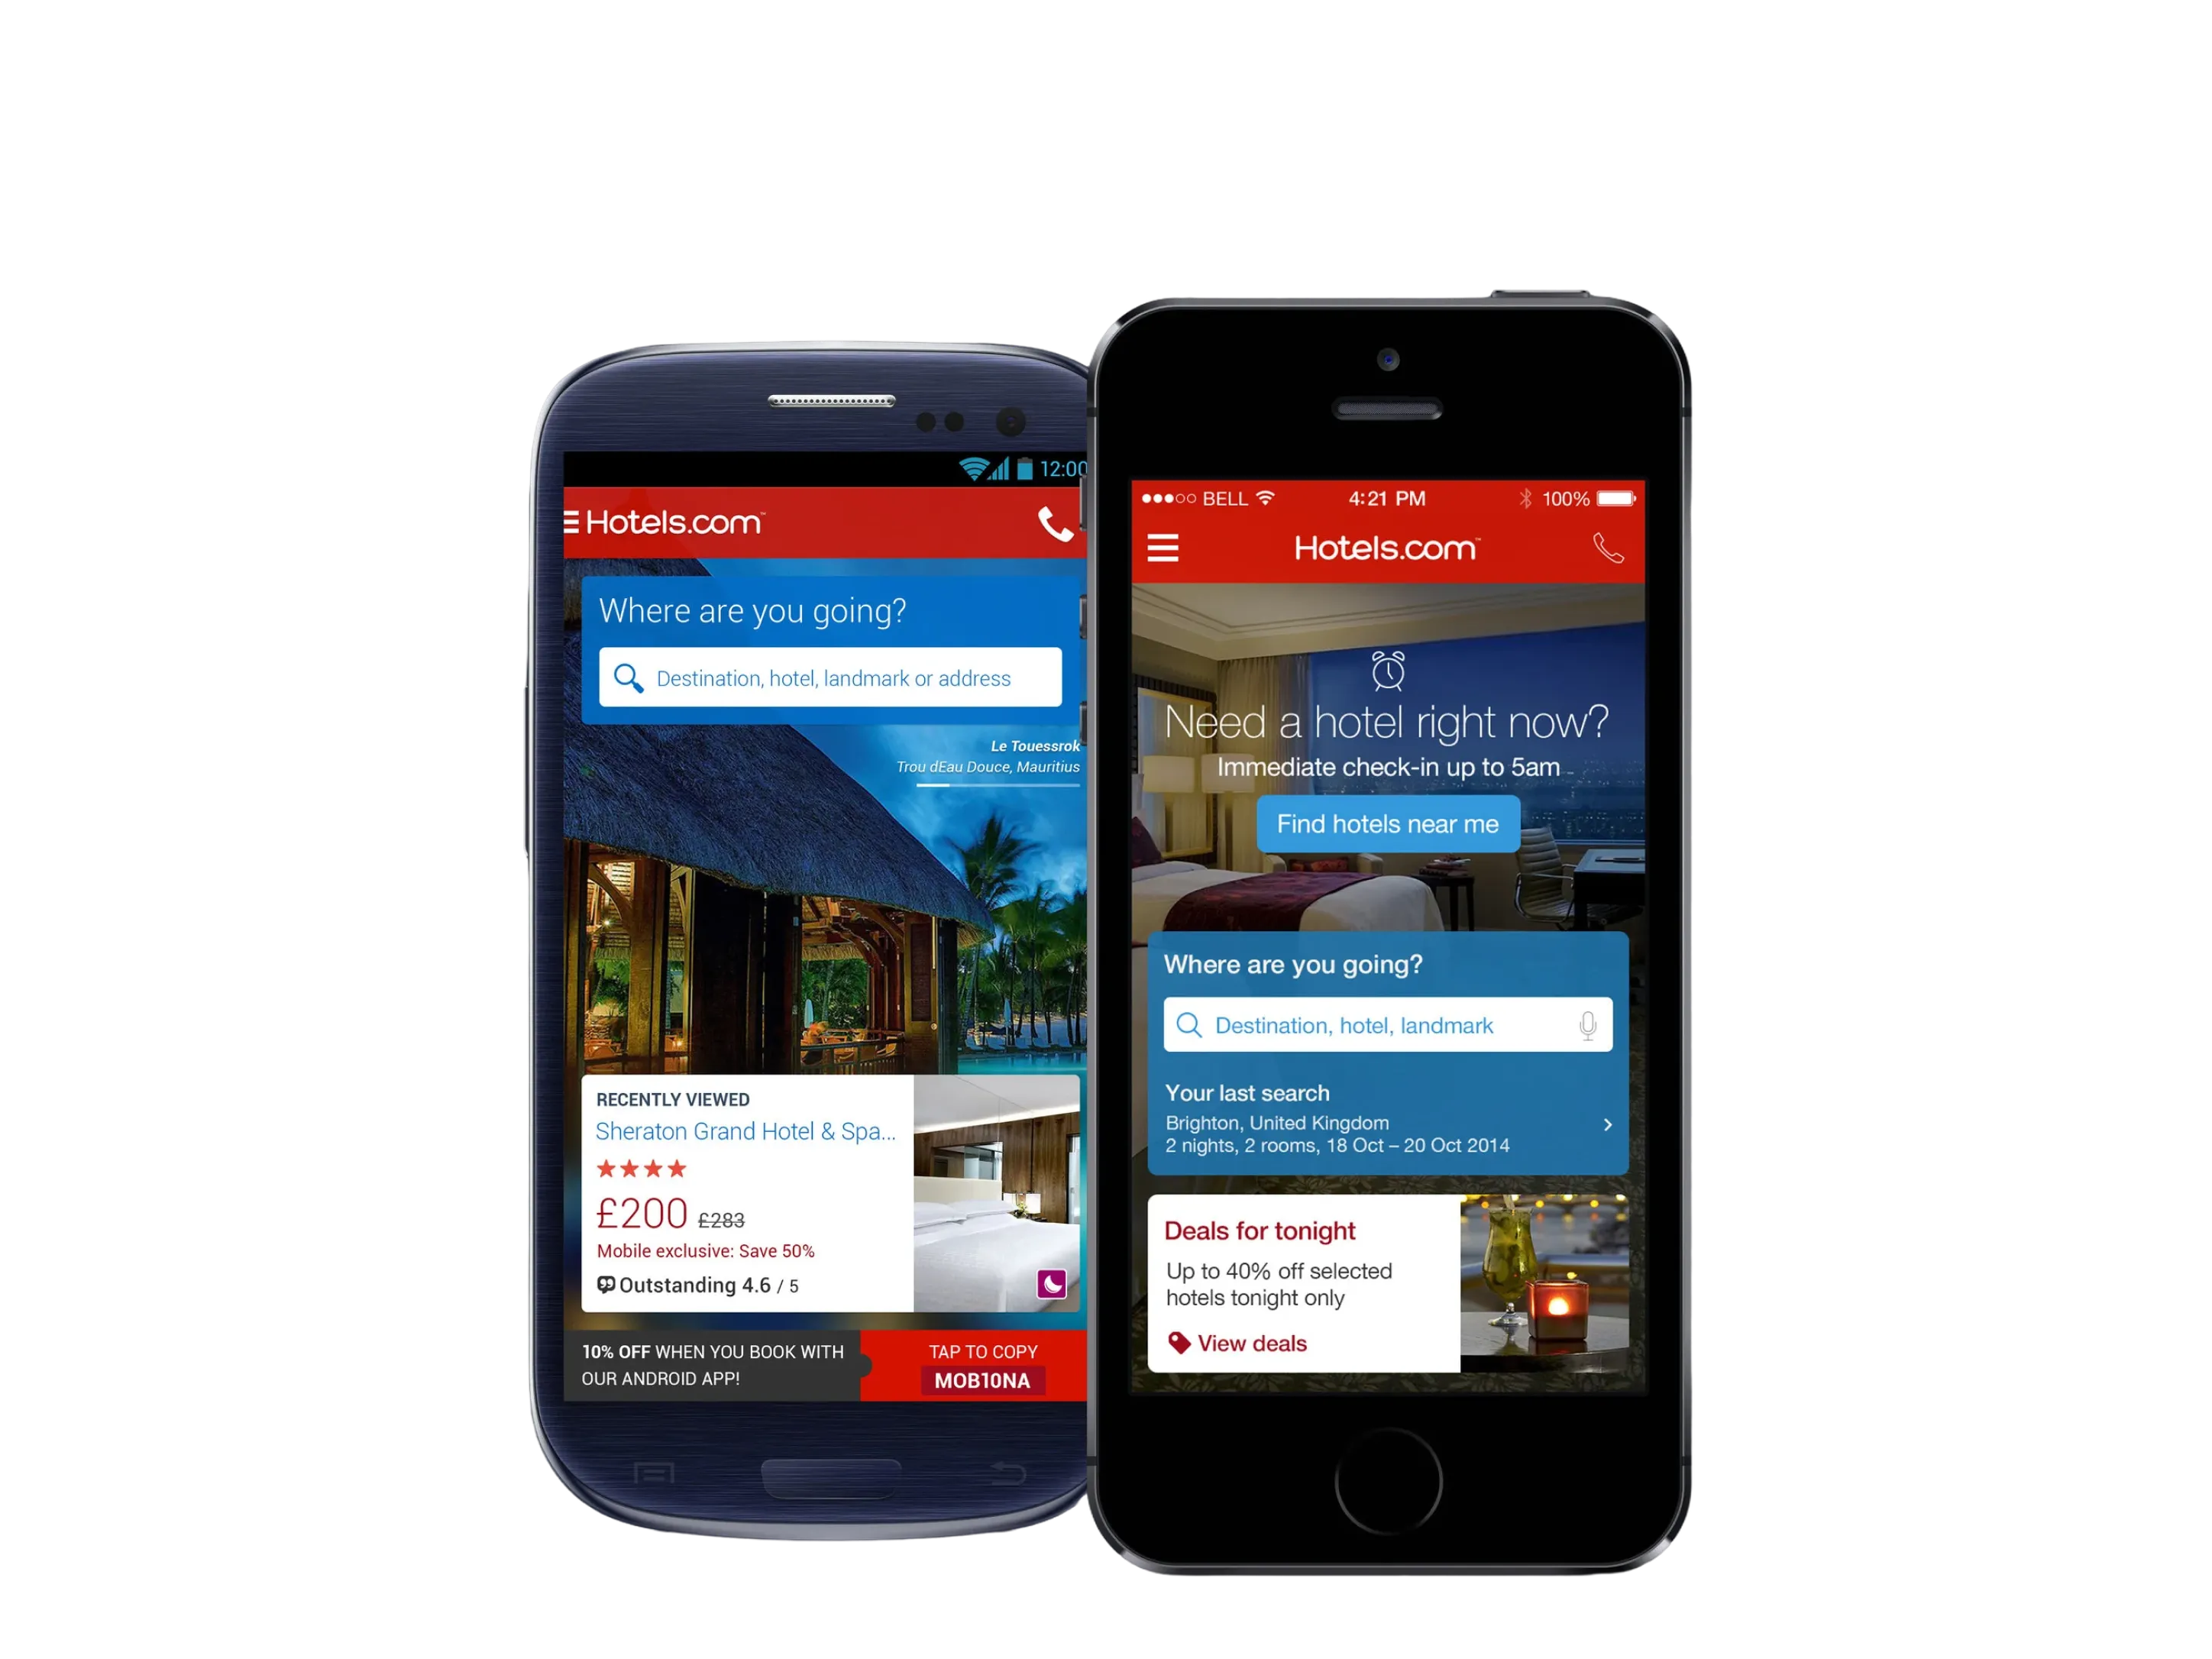
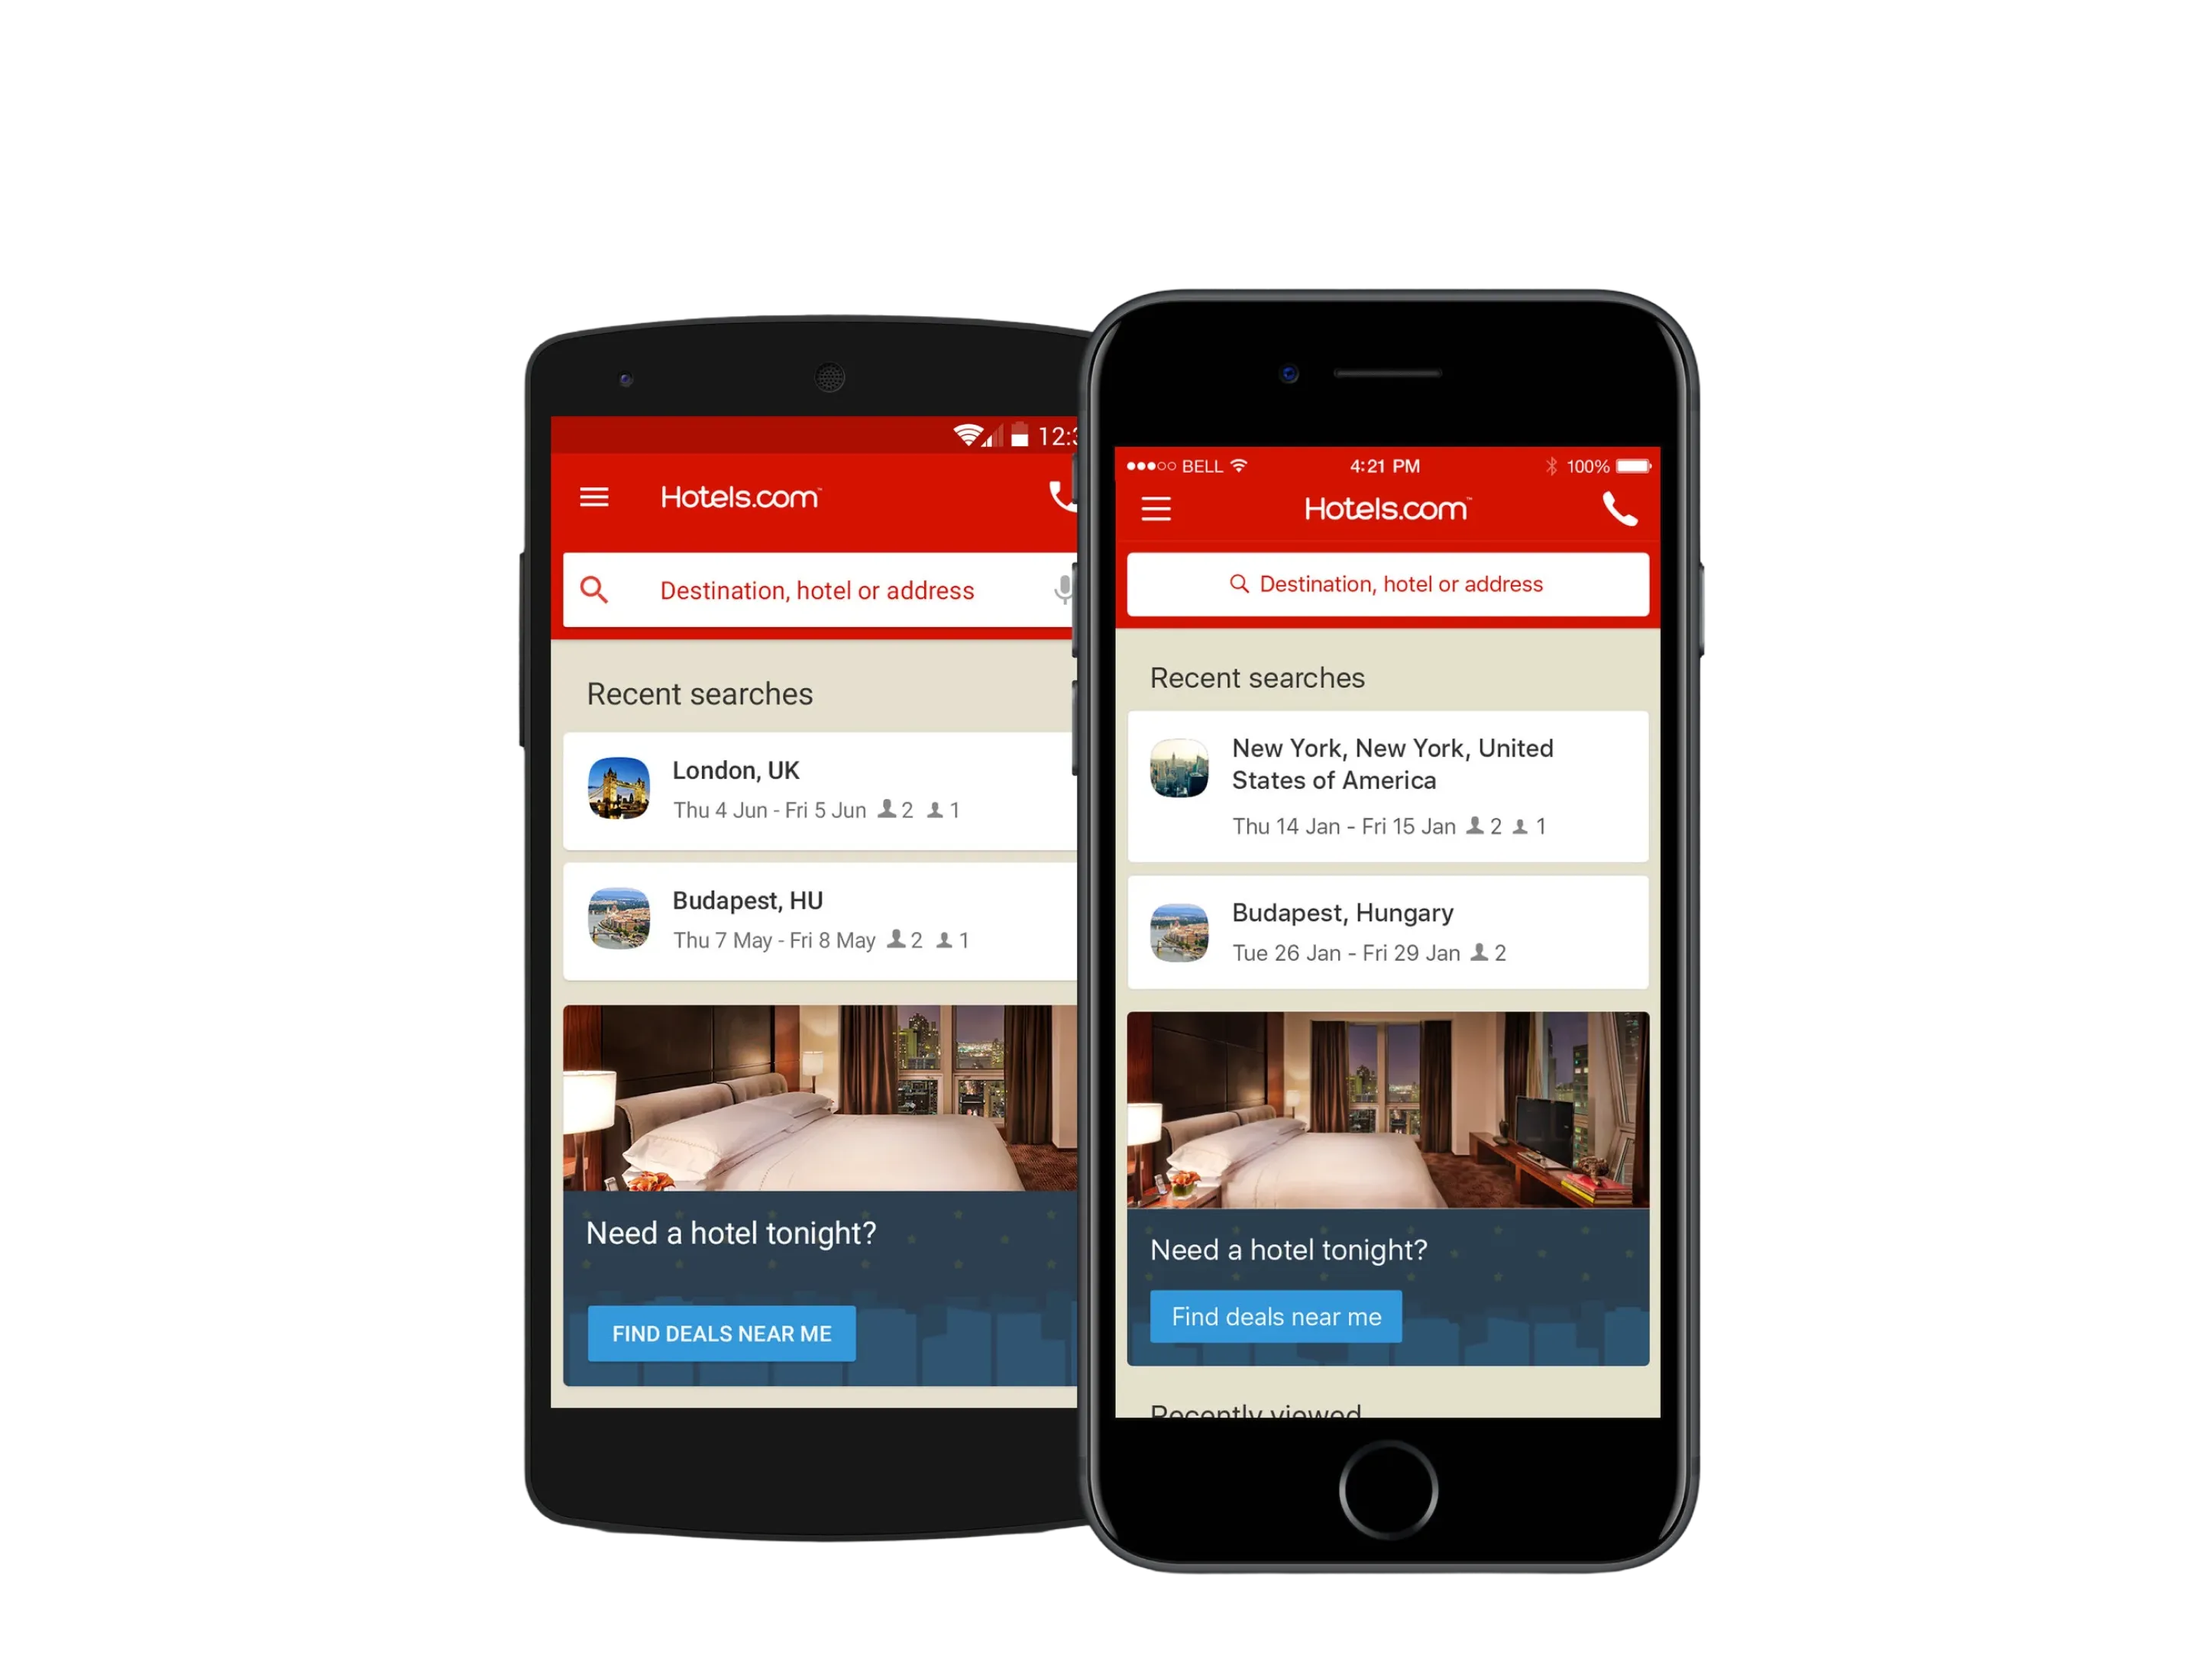
Five years and three homes. The 2014 screen sells at you. The 2016 screen is the card system, with search and what you last looked at first. By 2019 the same cards open on the trip you have already booked, and a destination guide sits with it.
On the home, modules carried recommended destinations, travel guides and trip content, and the mix changed with context rather than staying fixed. What appeared, and in what order, became the variable, where before it had been drawn once and shipped. Each card had a rule. Secret Prices showed on a first visit, until dismissed. Rewards asked people to join or sign in, then showed the nights they had stayed. Recent searches and hotels showed after browsing. Trip cards carried the stay before, during and after. Need a hotel tonight showed to everyone. Search stayed in a bar above the cards, in place of the large form. Trip cards came to iOS later, so the first test could cover the rebuild on its own.
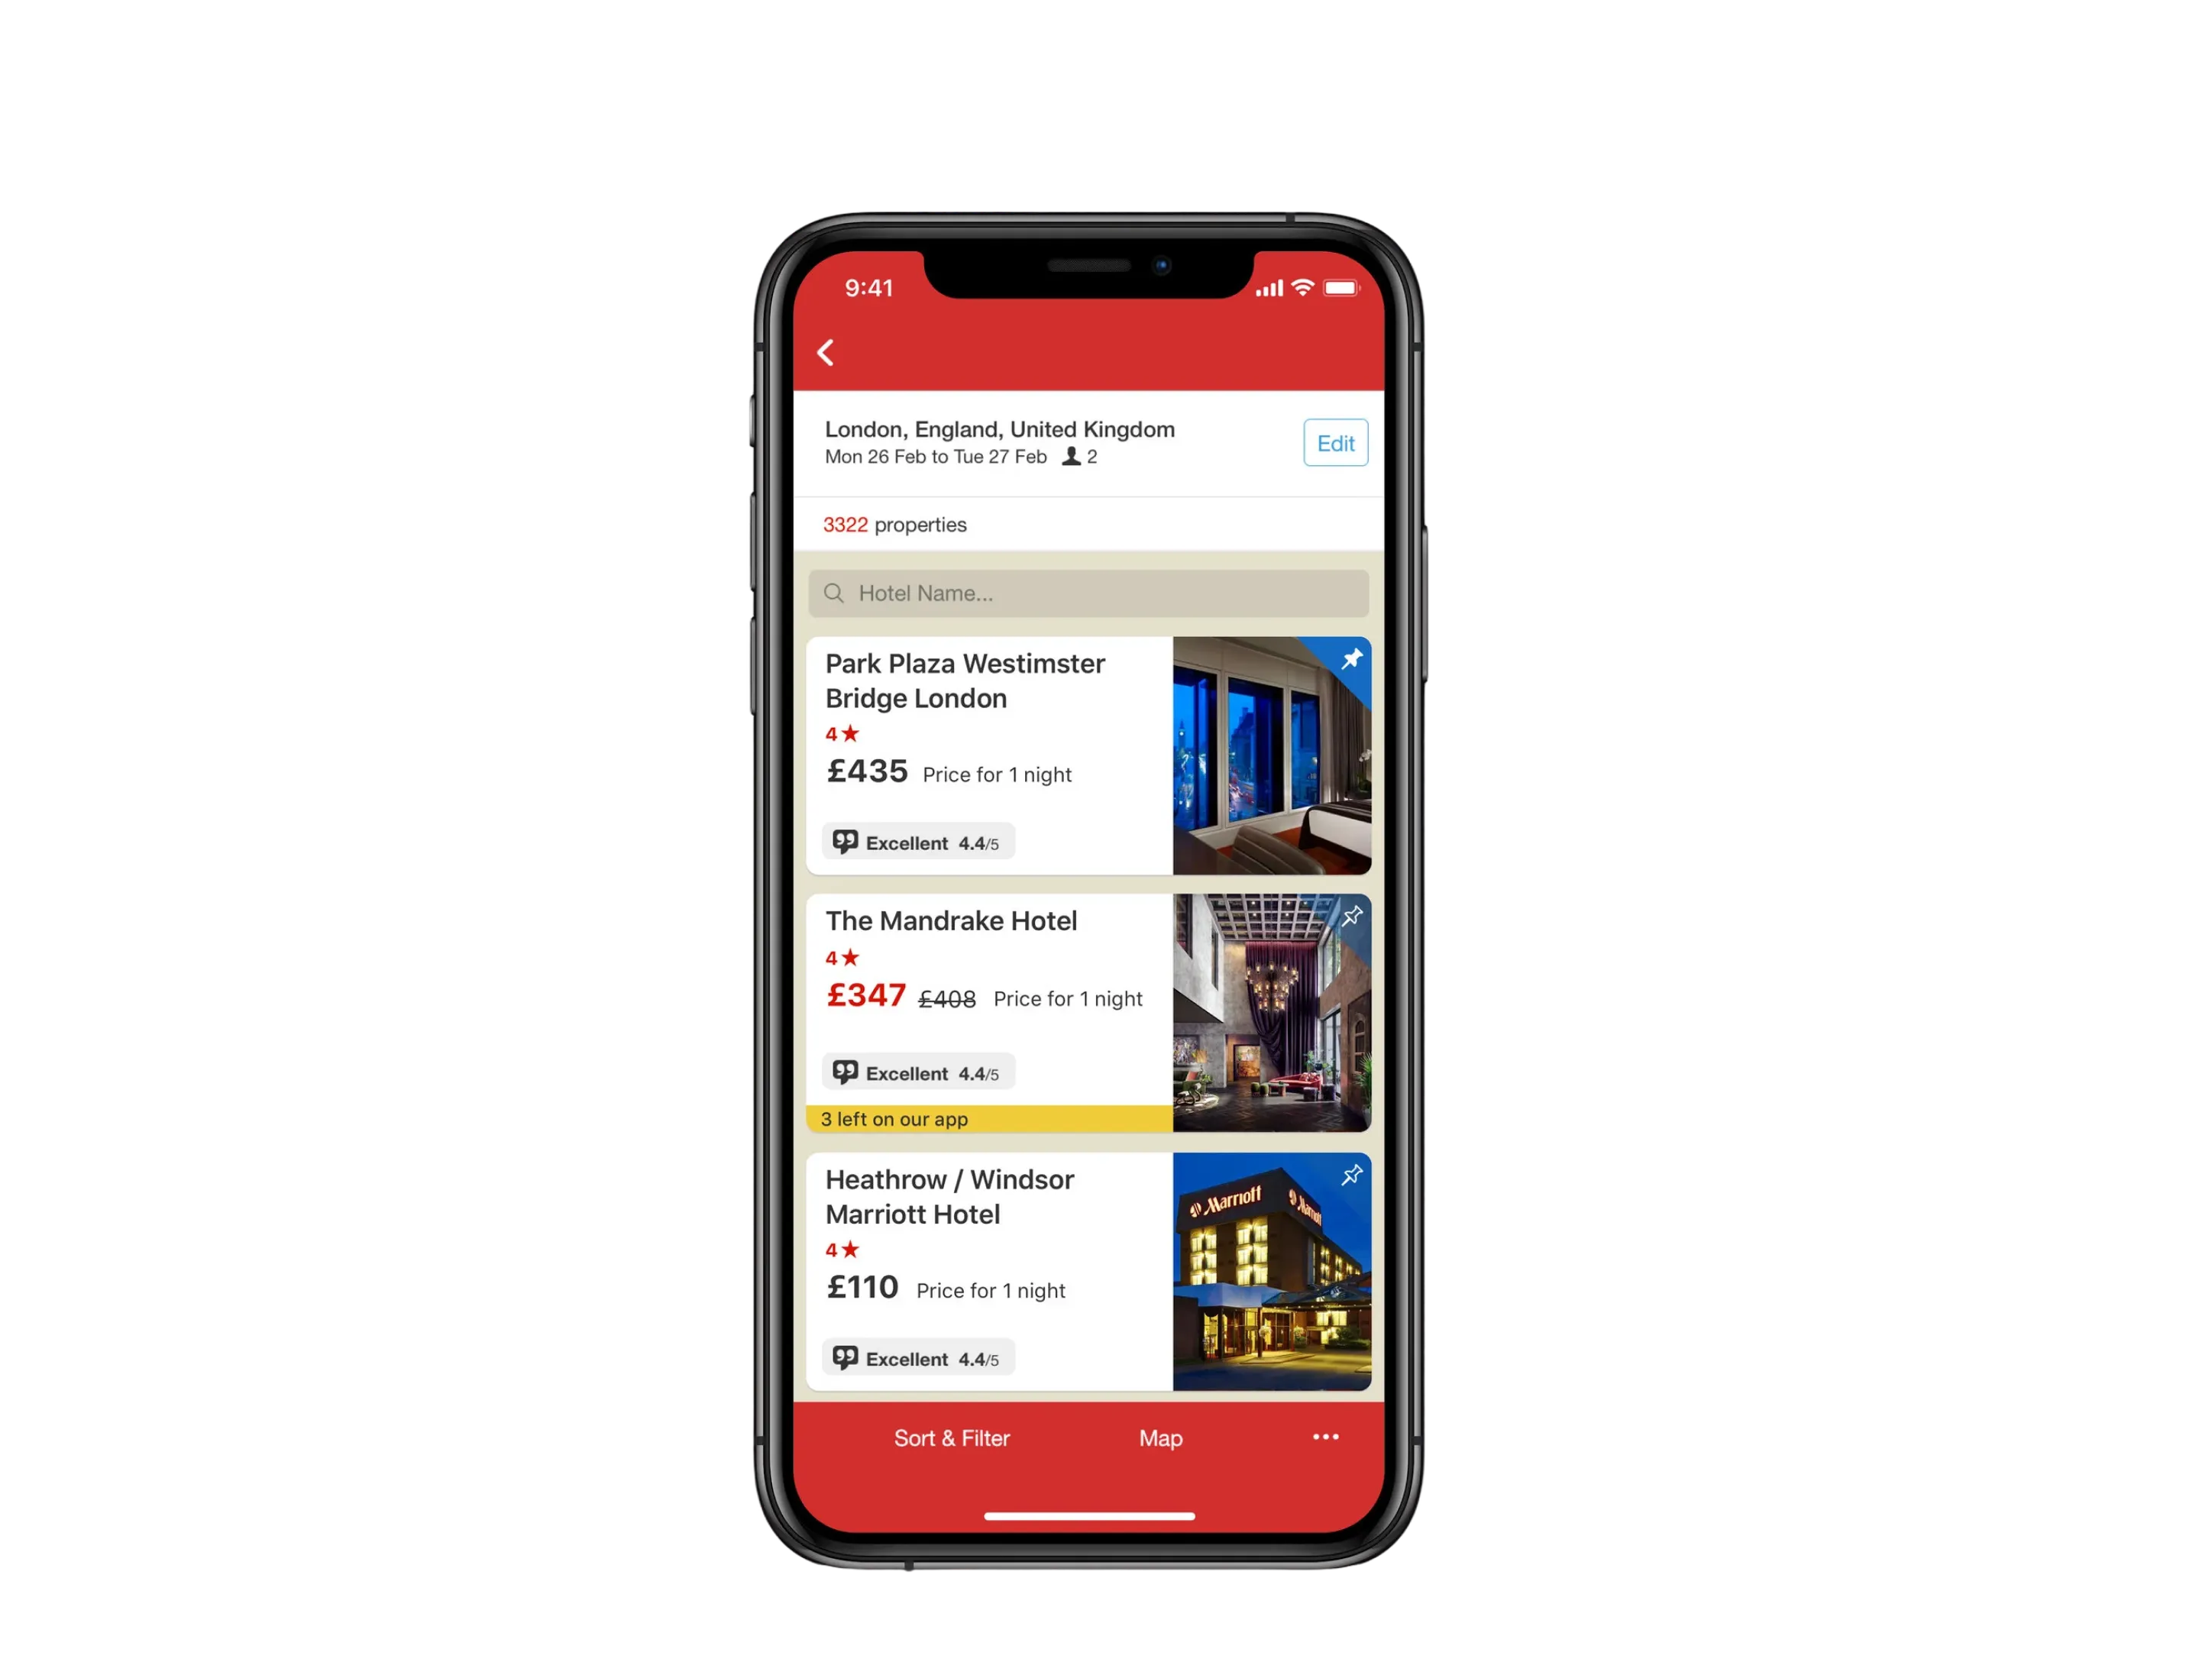
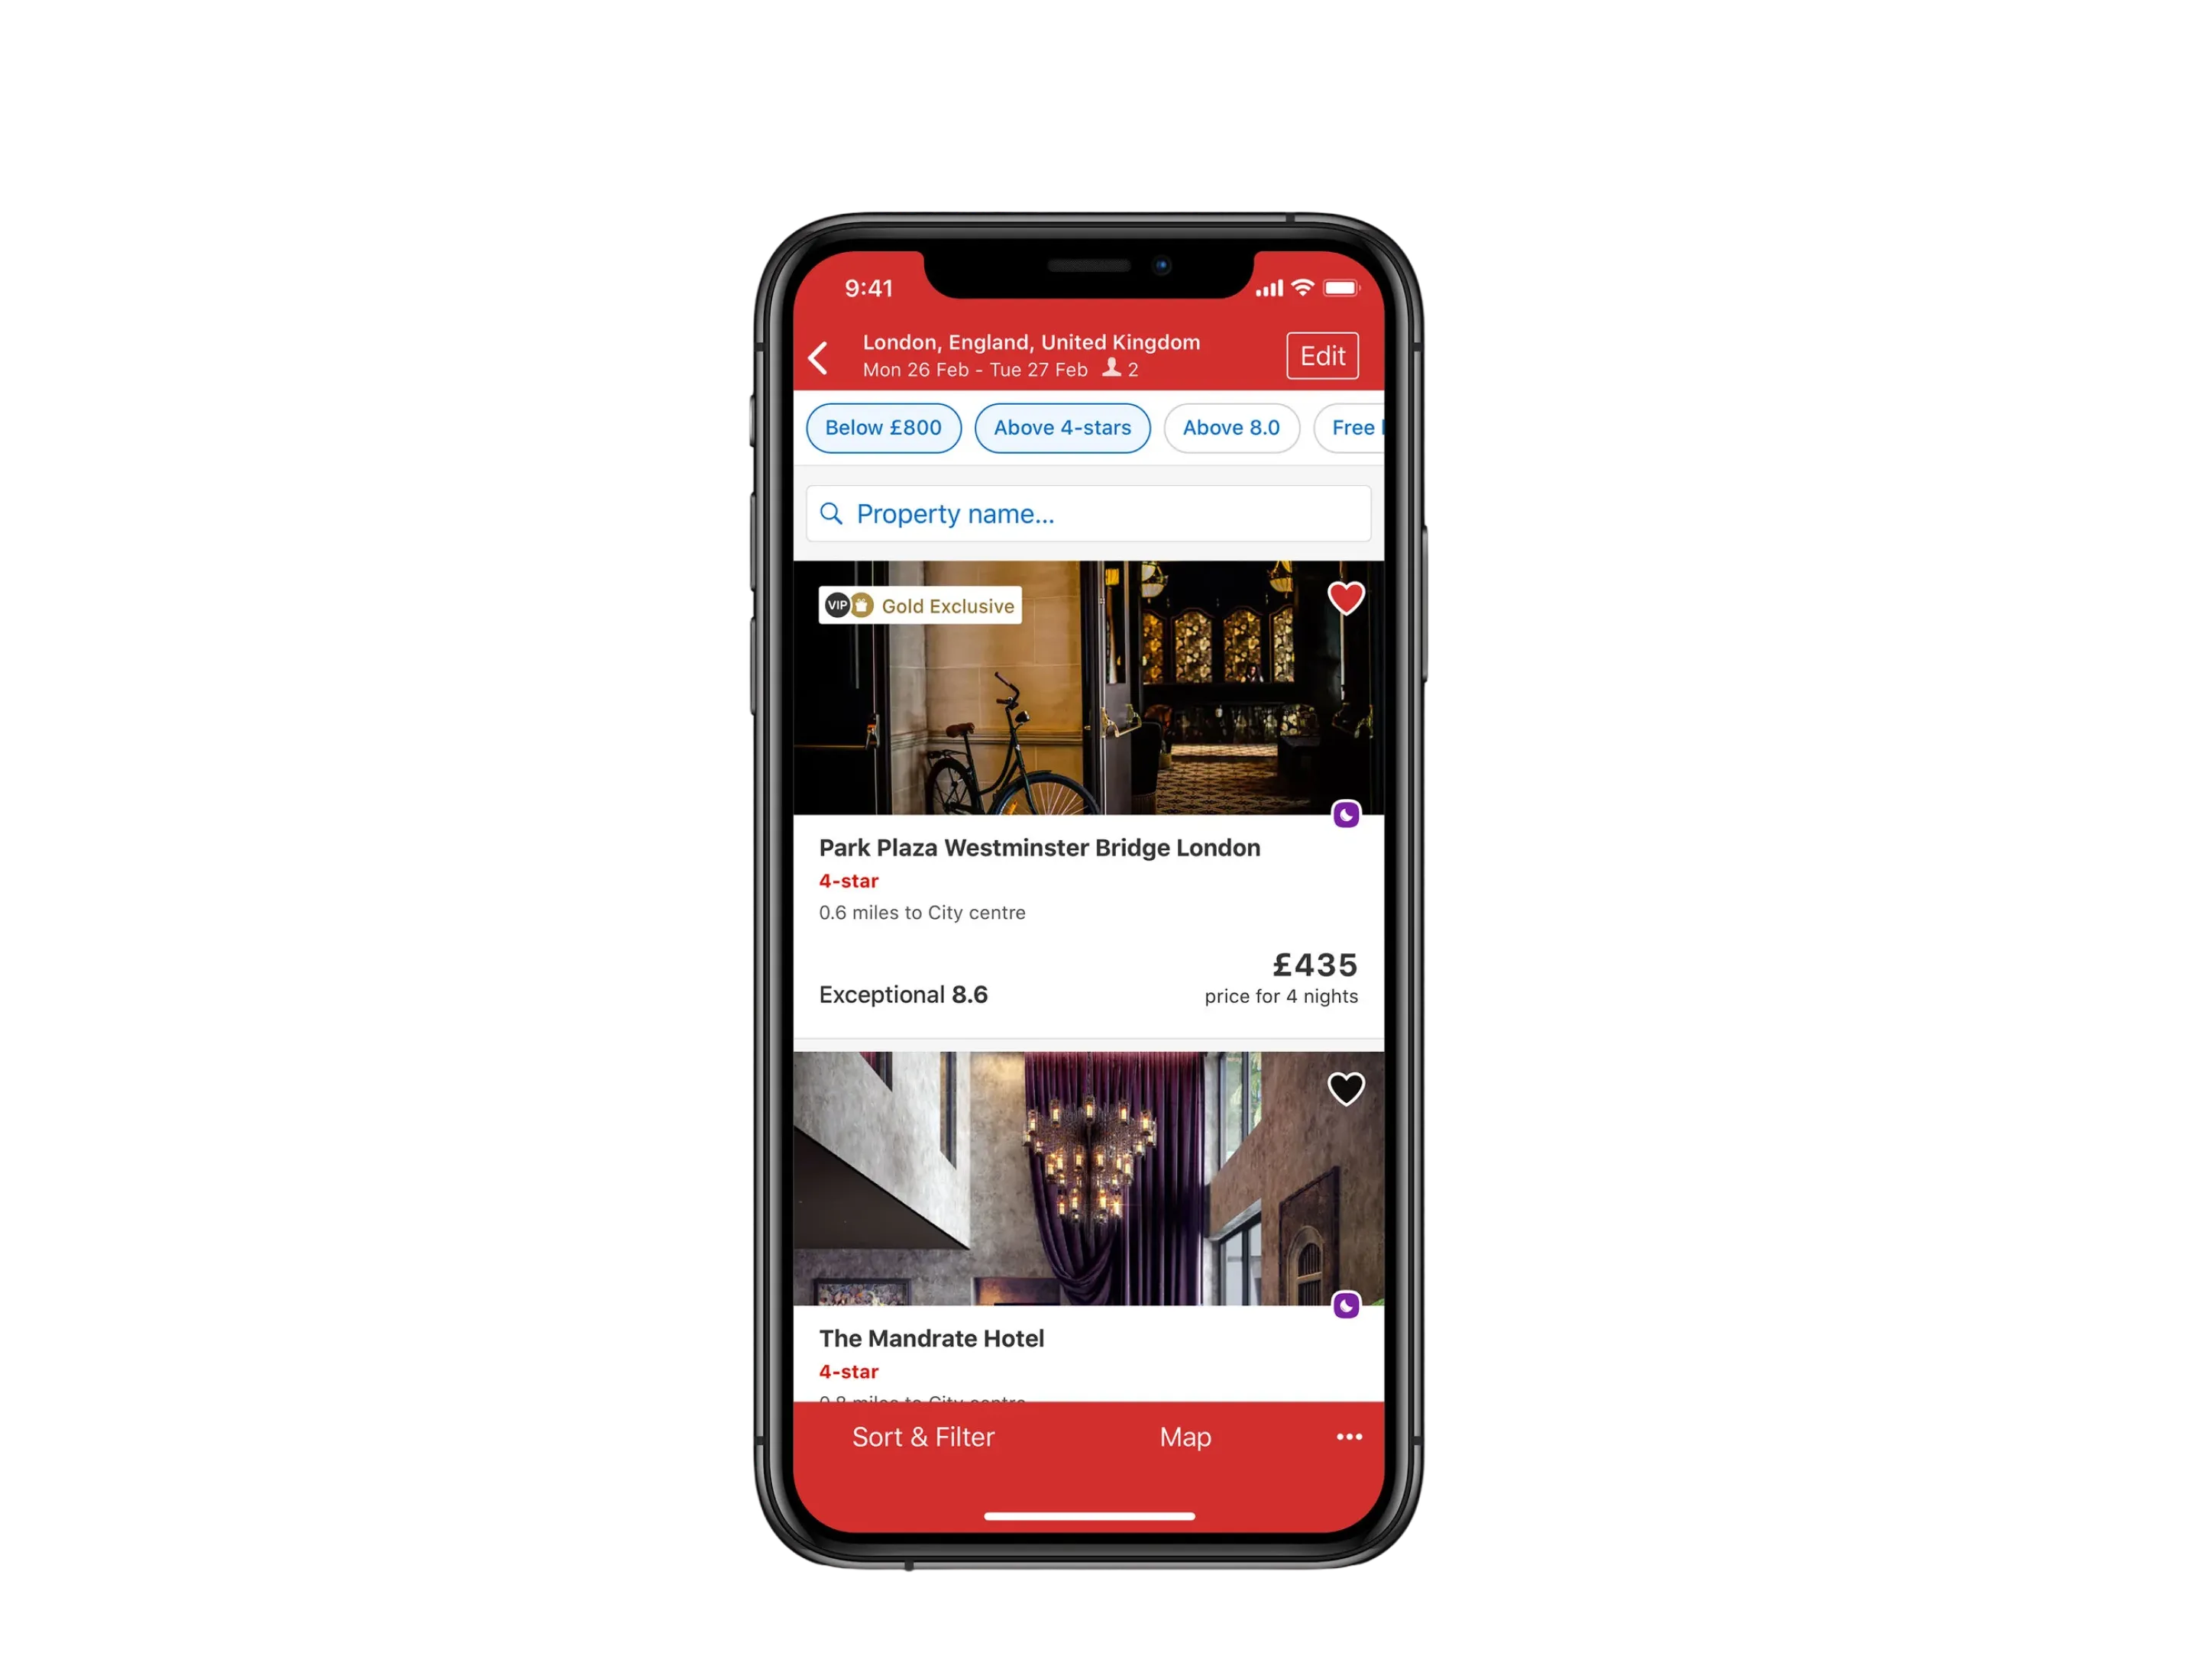
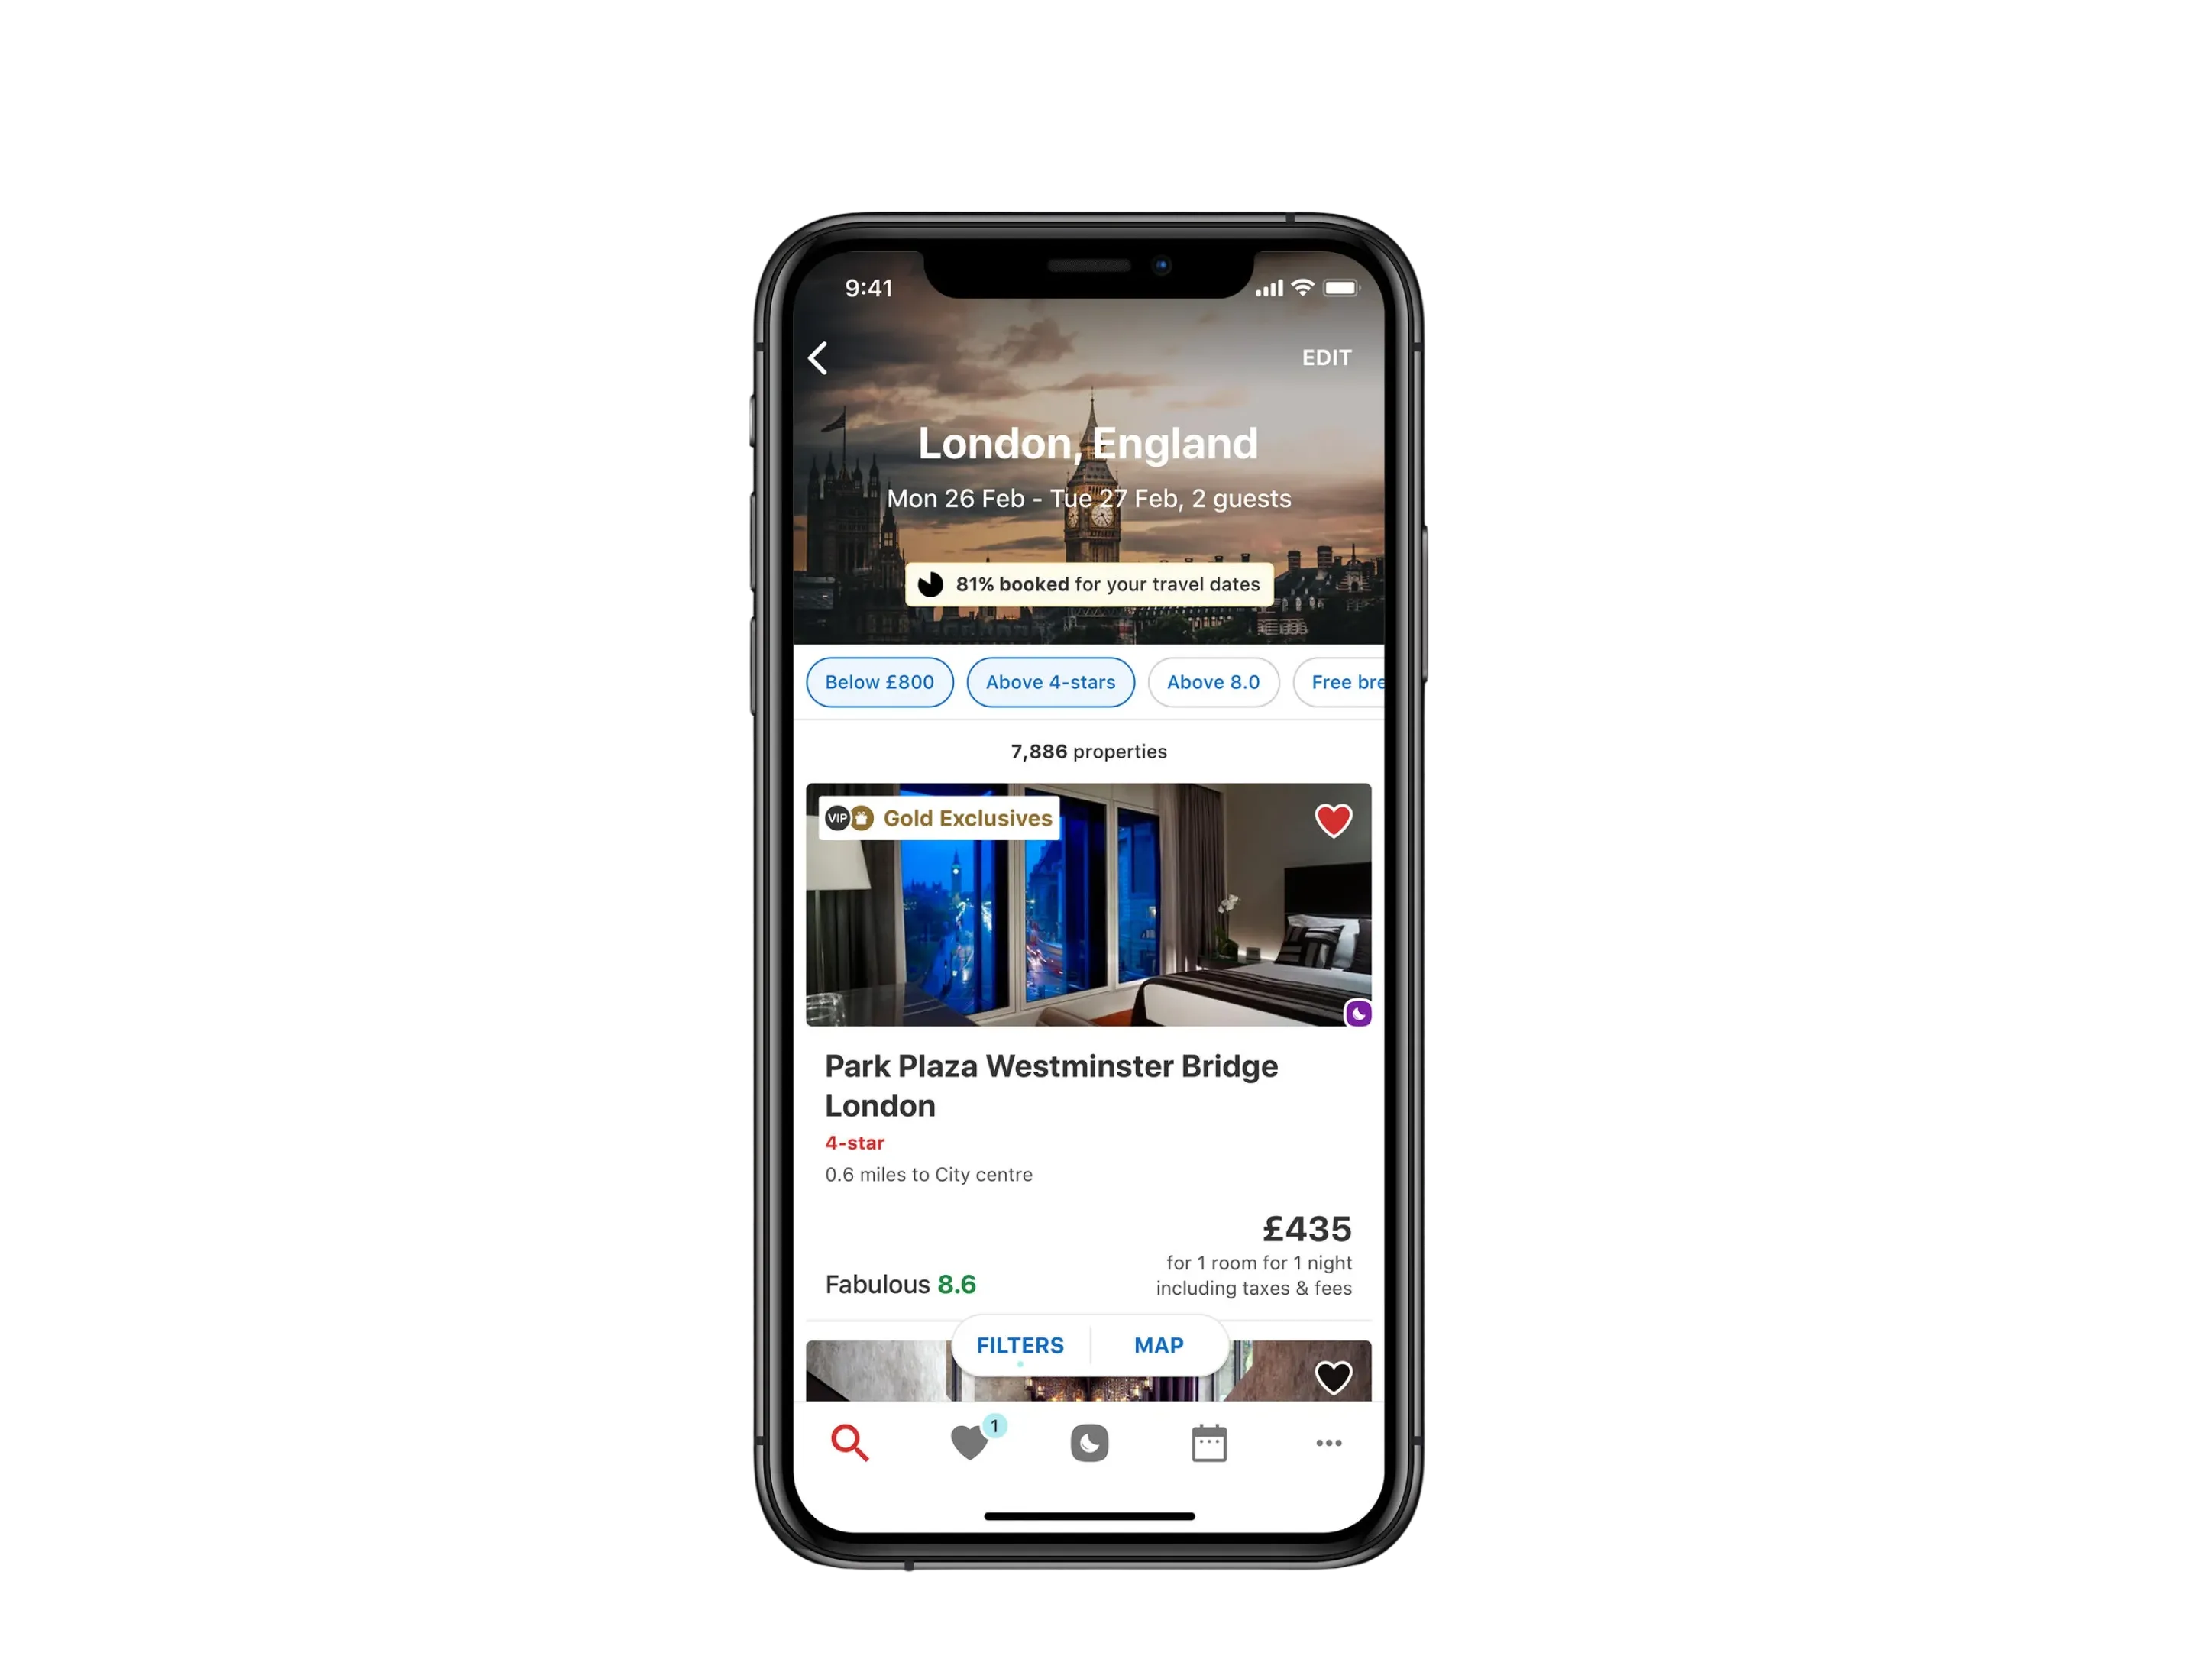
Before: one fixed row, with a rating out of five and no filters above the list.
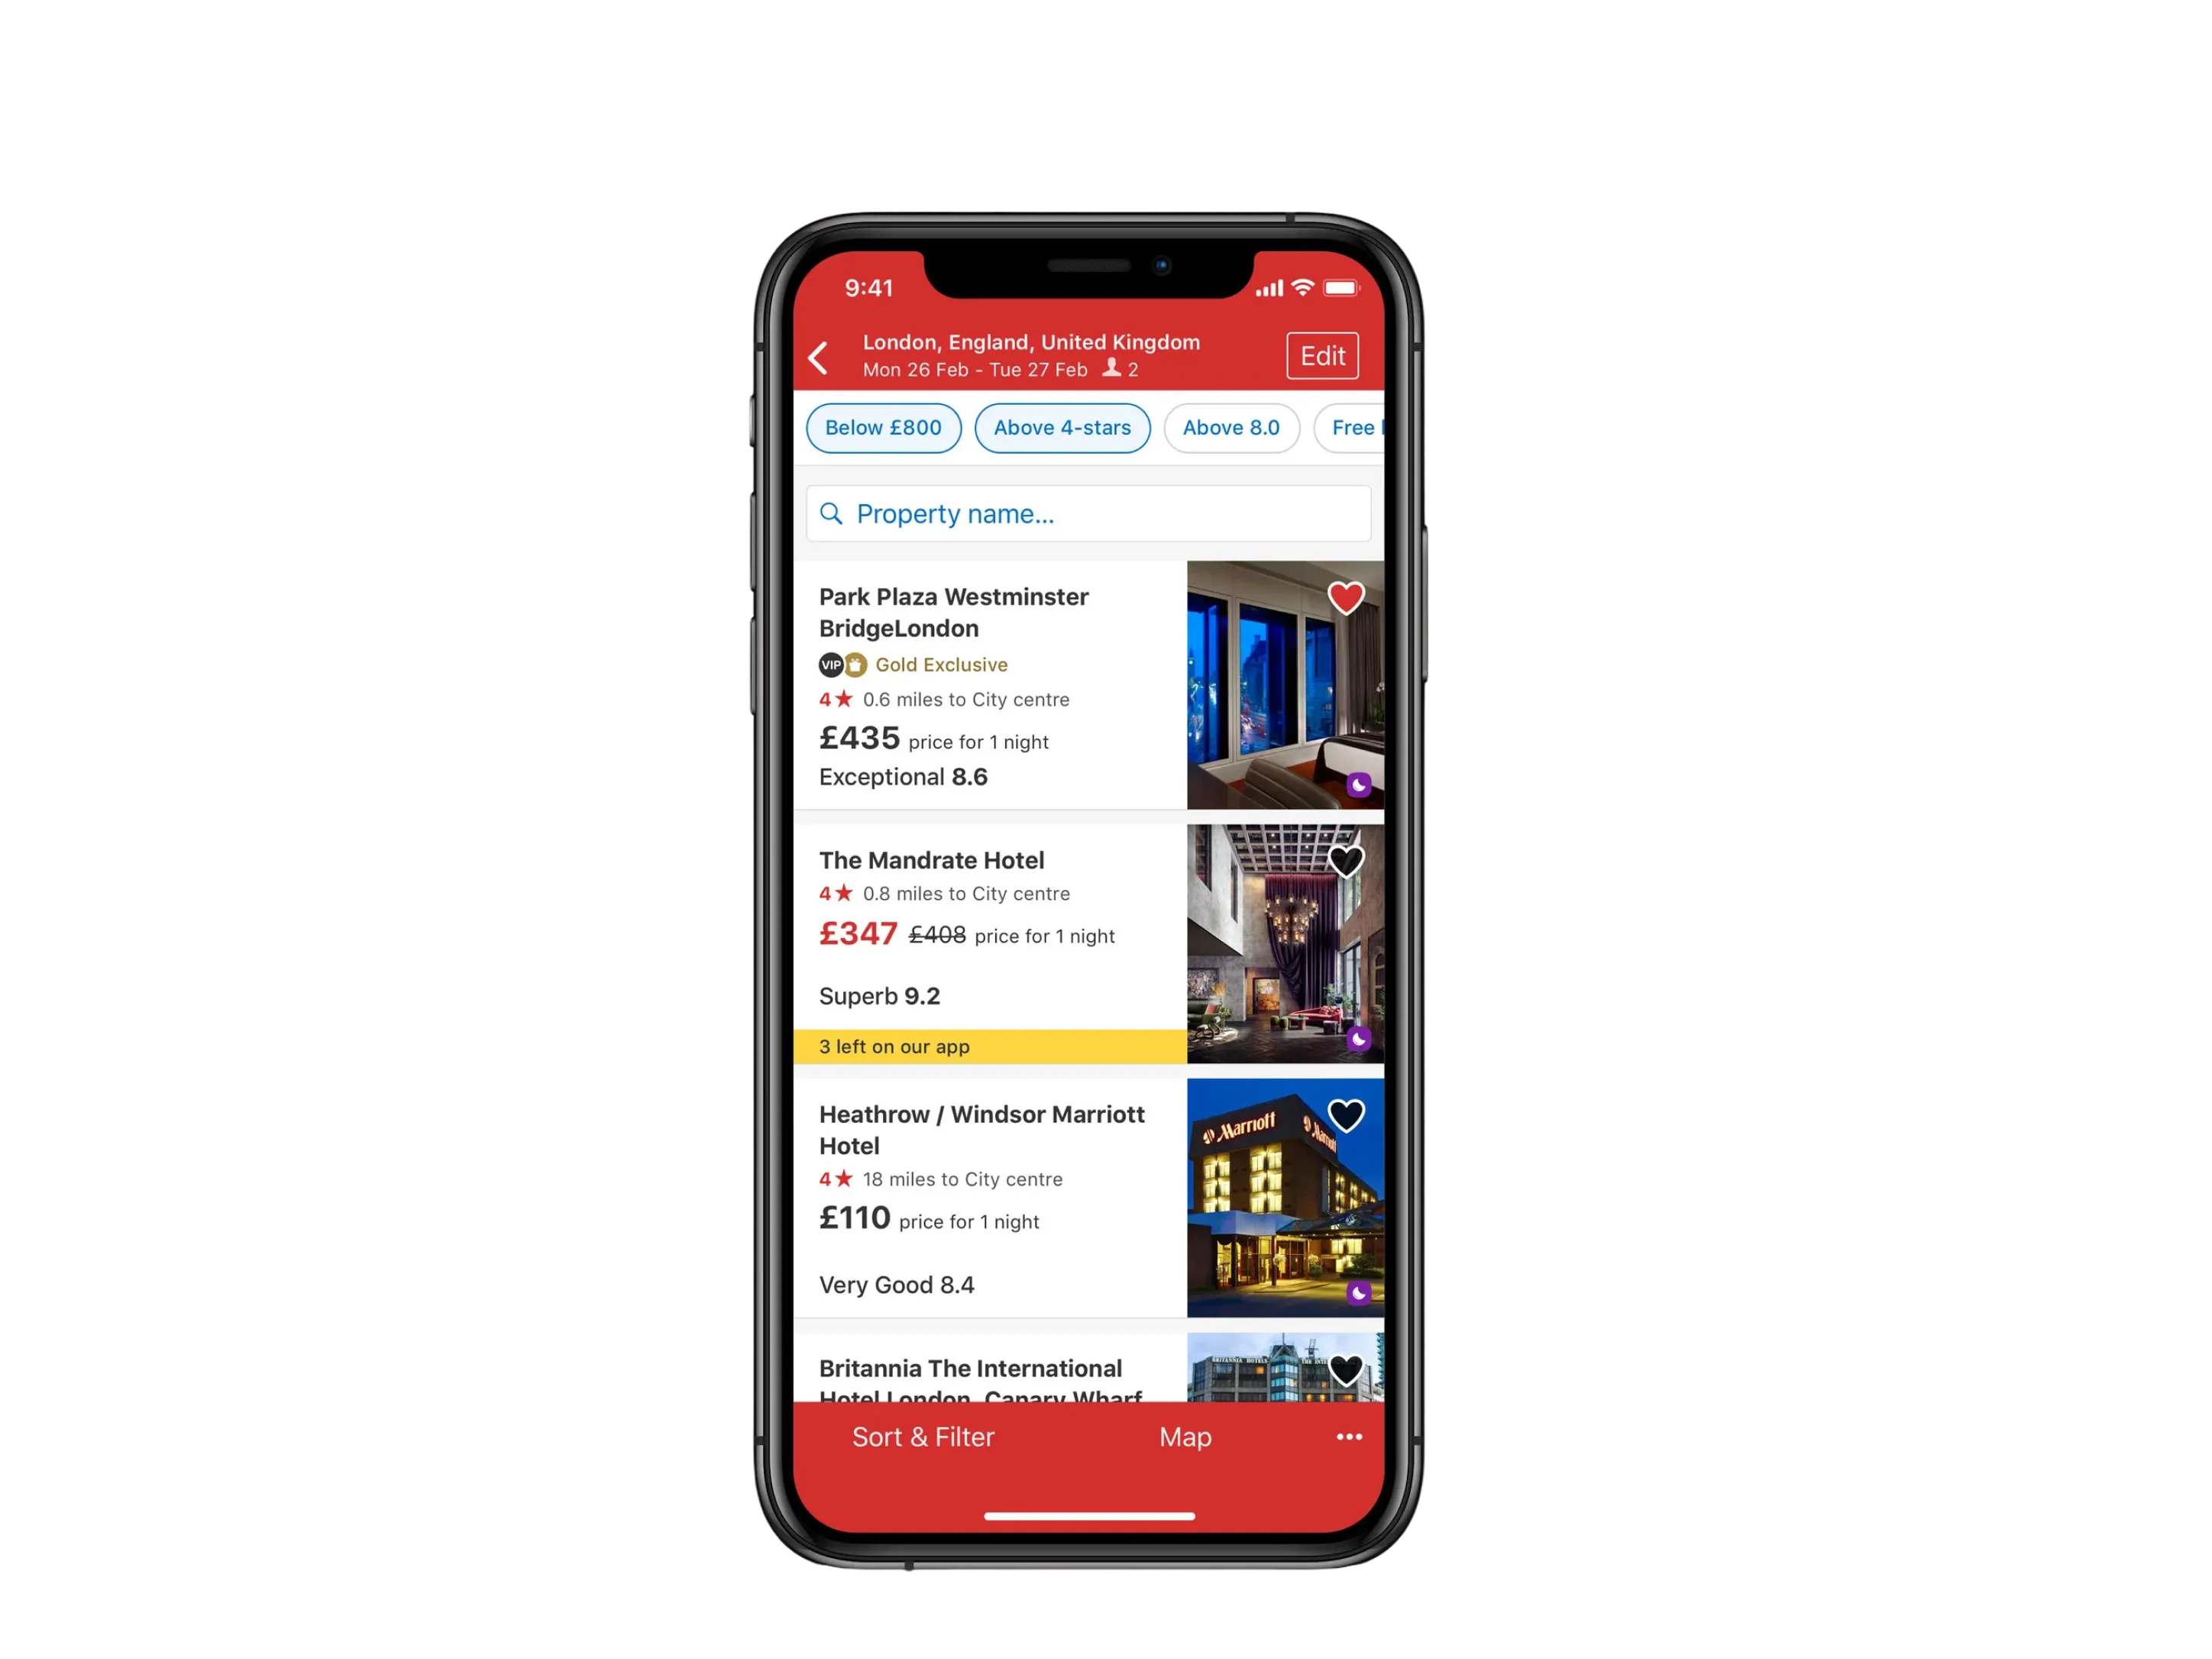
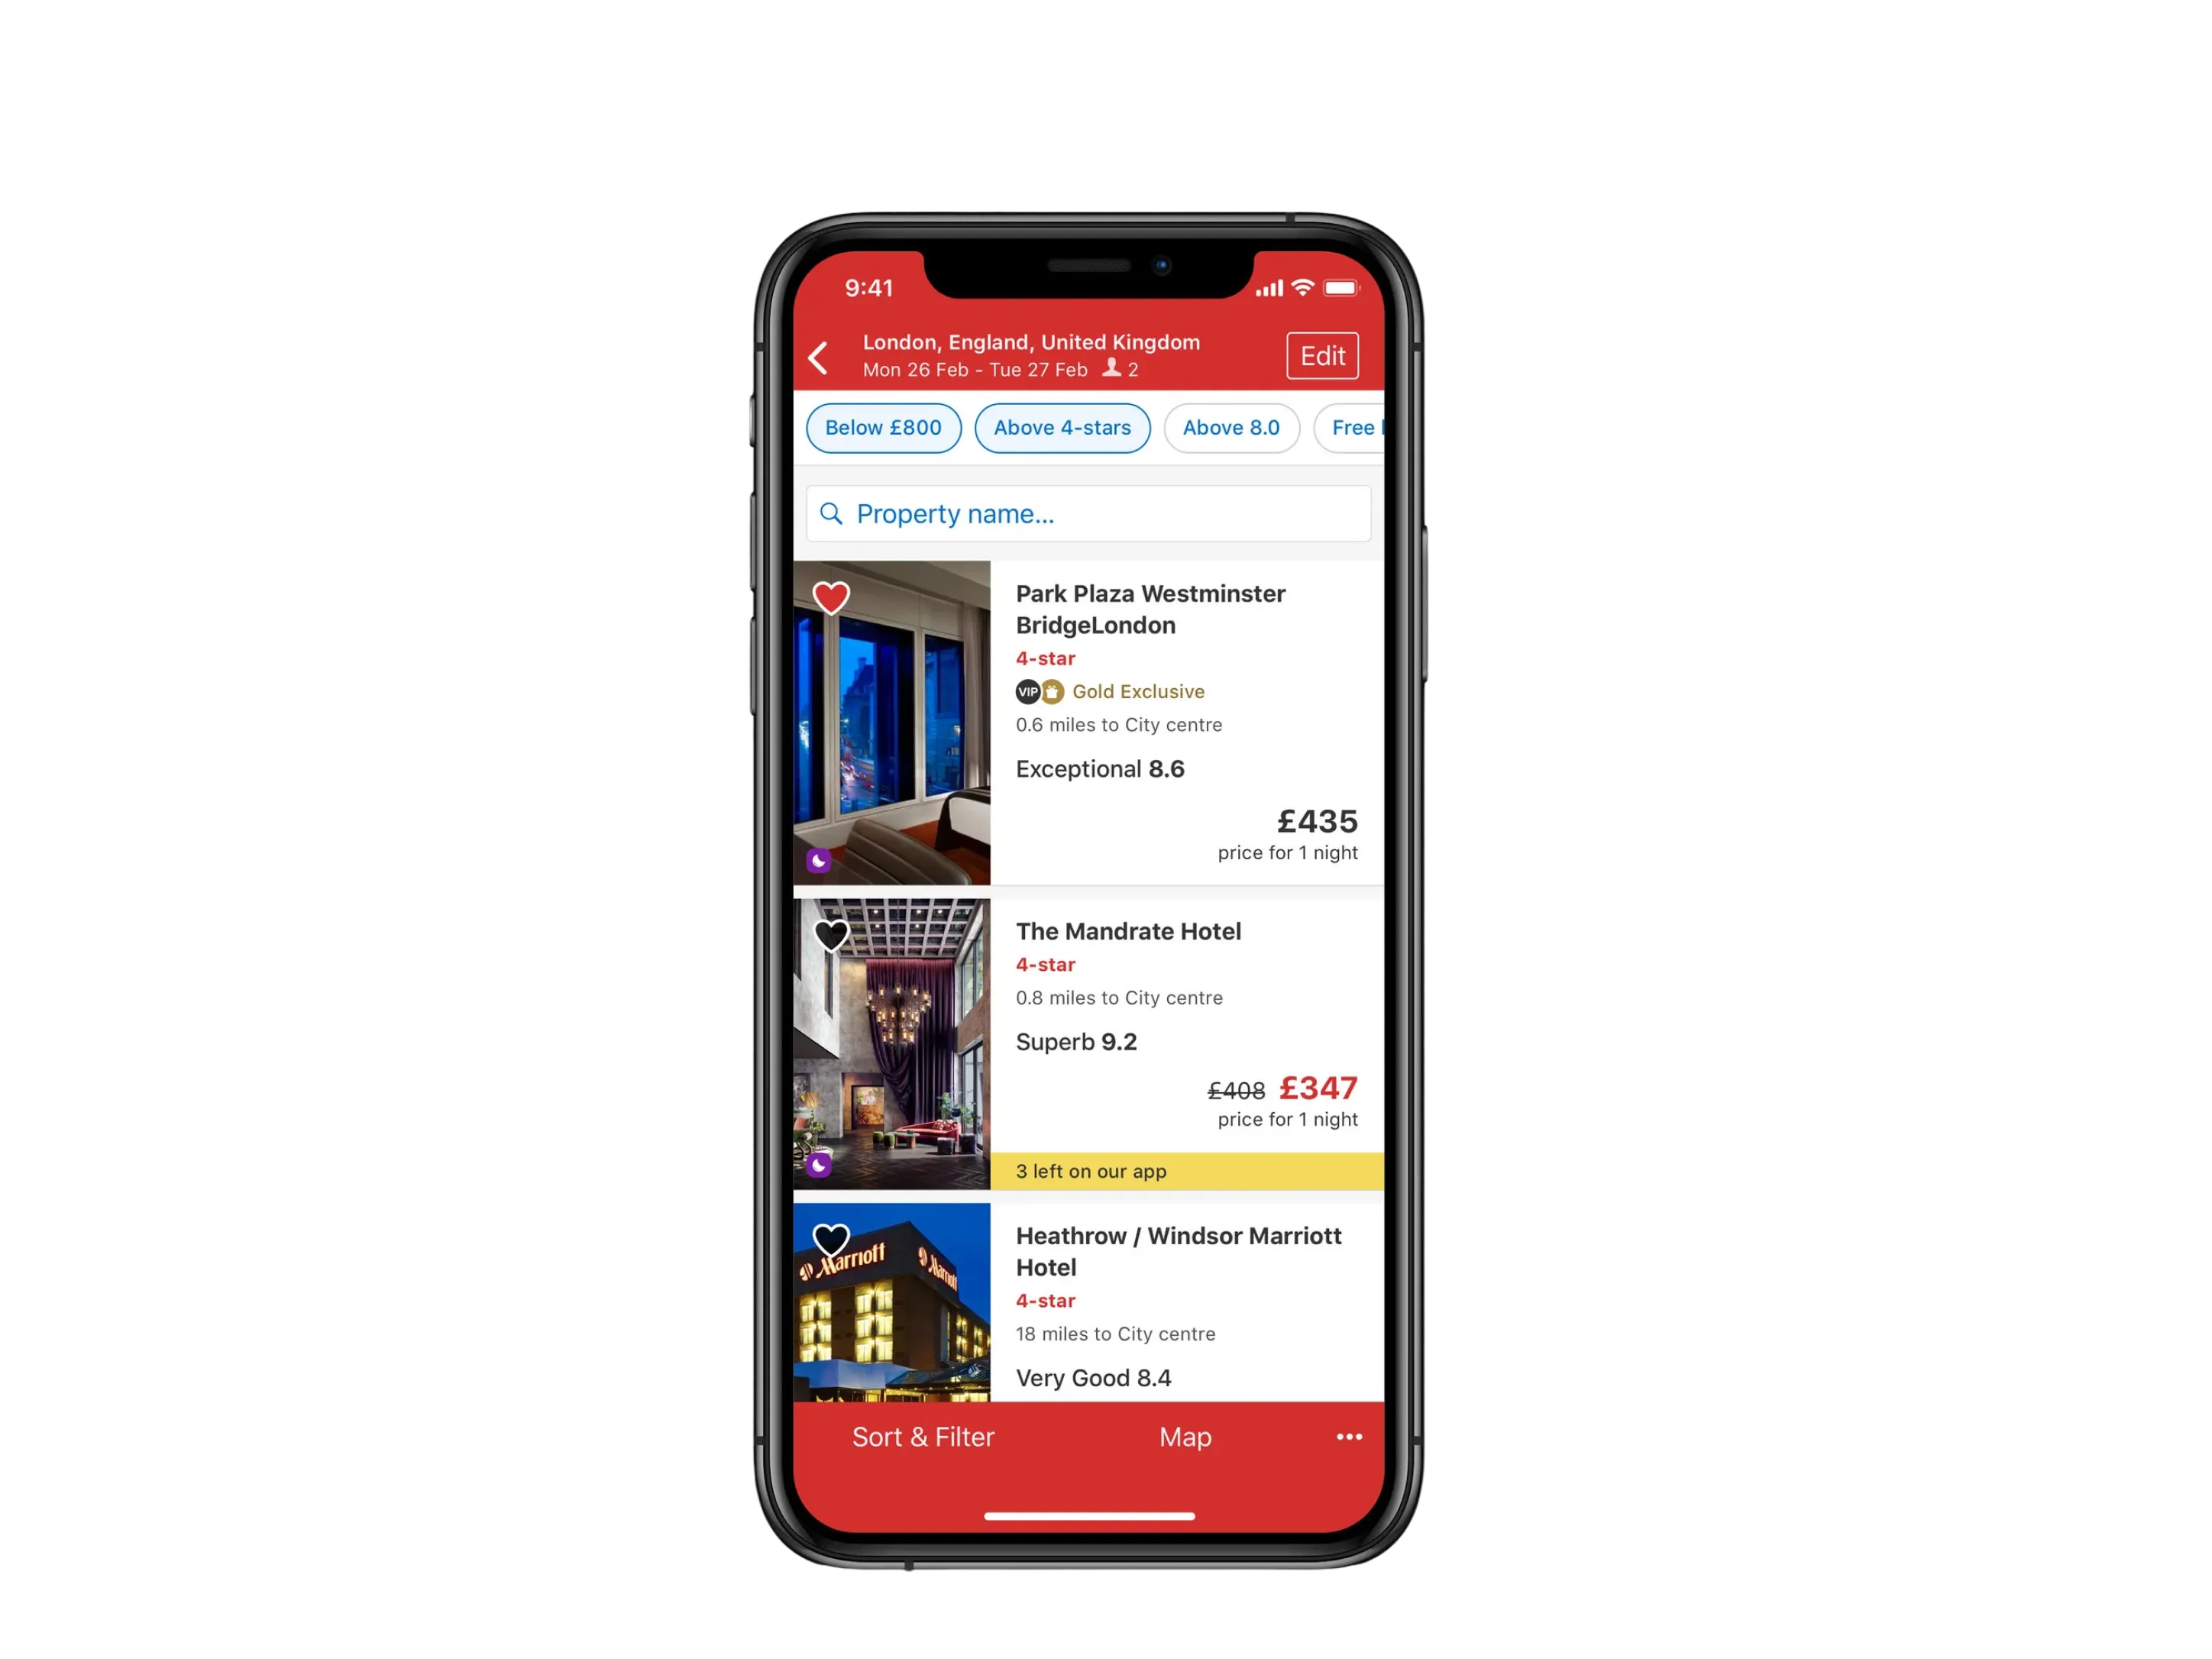
The layout that existed, the three built to be tested against each other, and where results went next. The middle three are the comparison: same chrome, same filters, same three properties, and the only variable is how much space a result is worth. Three fit on screen in the text-led layout, and one and a half in the full-bleed one.
On results, three adaptive layouts were built and tested against each other, each carrying a different balance of price, image and review content in the same slot. That gave us one card in three densities, with the framework underneath deciding which one a given result deserved.
The home’s booking numbers come from two tests in 2016. The iOS result is the clear one.
Hotels.com analytics readouts MVT-3480 (Android, 11 April to 12 June 2016, 1.3 million users, 91% confidence) and MVT-4513 (iOS, 3 October to 15 November 2016, 2.1 million users, above 99%). Booking tiles are extra bookings for every 100 on the old home screen. Android’s change for everyone was +0.6 and could be chance: the readout’s range includes no change. People new to the Android app were +1.5, worked out from the published counts. The profit estimate assumes a flat 12% margin. Also counted from the home screen: sign-in visits +25% on Android and +11% on iOS, Rewards visits +33% and +17%, and visits to the sign-up form +191% on Android.
On iOS, bookings rose by 2.5 for every 100, and by 4.0 among people new to the app. Accounts created rose 85%. Android’s result for everyone could be chance, so the $3.6 million estimate stays with iOS. On Android, visits to the sign-up form rose 191%.
On the new iOS home, the share of visits that reached a hotel page moved from 14.7% to 18.9%, and sign in from 12.3% to 15.8%. The share that stopped at search results moved from 36.6% to 34.2%. Android’s search share moved from 55.5% to 57.0%, sign in from 6.4% to 8.0%, and account creation from 0.6% to 1.8%. The two tests counted visits differently, so the change on each platform is what compares.
The search rebuild’s own result was reported in direction rather than as a figure: a strong positive, led by the US point of sale, with more customers returning within 30 days and more shortlisting.
Next
Design systems
Each brand kept its look through tokens, and the components were built once.